13.

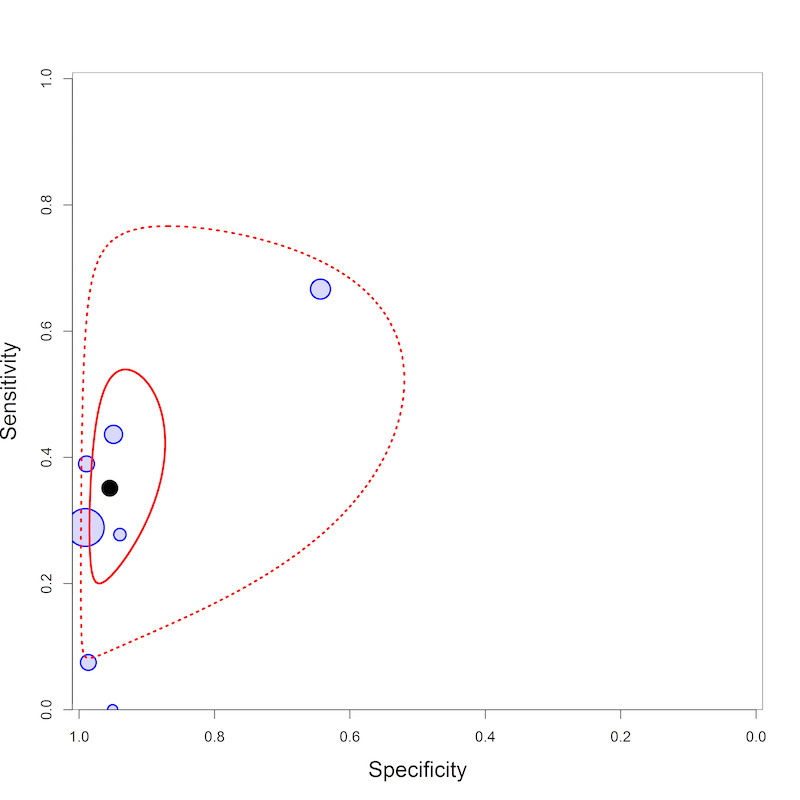
Summary plot of LF‐LAM sensitivity and specificity for tuberculosis detection in unselected participants. The blue circles represent individual study estimates for sensitivity and specificity for the studies among unselected participants. The size of the circle is proportional to the sample size of the study. The filled black circle is the pooled estimate for sensitivity and specificity. The solid red line marks the 95% credible region around the summary estimate, the dashed red line marks the 95% prediction region.
