
14.
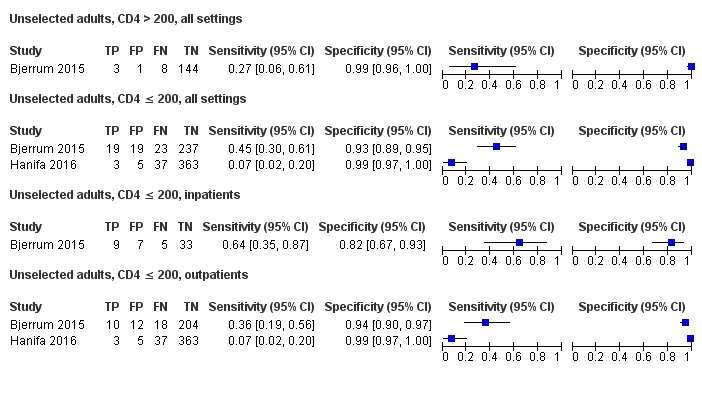
Forest plots of LF‐LAM sensitivity and specificity for tuberculosis against a microbiological reference standard for studies among unselected participants, by CD4 strata (CD4 > 200 and CD4 ≤ 200) and health setting. The individual studies are ordered by decreasing sensitivity. TP = True Positive; FP = False Positive; FN = False Negative; TN = True Negative. Between brackets are the 95% confidence interval (CI) of sensitivity and specificity. The figure shows the estimated sensitivity and specificity of the study (blue square) and its 95% CI (black horizontal line).