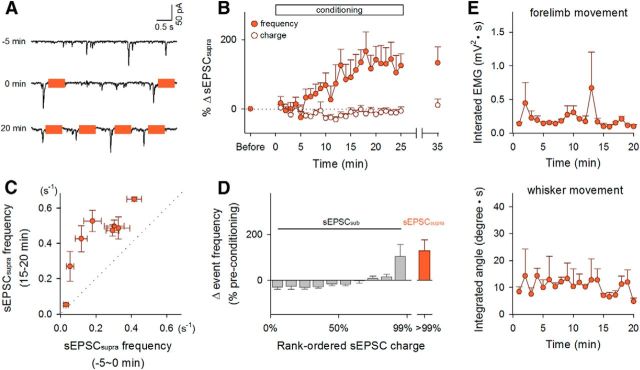
Figure 2.
Neurofeedback-mediated reinforcement of sEPSCsupras in hippocampal neurons. A, sEPSC traces recorded from a representative neuron at −5, 0, and 20 min relative to the onset of conditioning. Colored bars indicate LH stimulation periods. B, Time courses of the percent changes in the mean frequency (closed circles) and the mean charge (open circles) of sEPSCsupras during the 25 min of conditioning. Error bars indicate the SEMs of 9 neurons from 9 mice; 6 of 9 neurons exhibited a significant change in the sEPSCsupra frequency. C, The sEPSCsupra frequency 15–20 min after the onset of LH stimulation was plotted against that measured 0–5 min before the reinforcement. Each data point represents the mean ± SEM of a single neuron. D, Percent changes in the frequency distribution of sEPSC charges during the postconditioning session relative to the preconditioning baseline. The sEPSC charges were rank ordered and normalized in each experiment. E, During operant conditioning, EMGs were recorded from forelimbs (top) and whisker movement was monitored (bottom). Neither the EMG power nor the whisker movement integral changed in the course of the development of sEPSCsupra reinforcement. Error bars indicate the SEMs of three mice.

