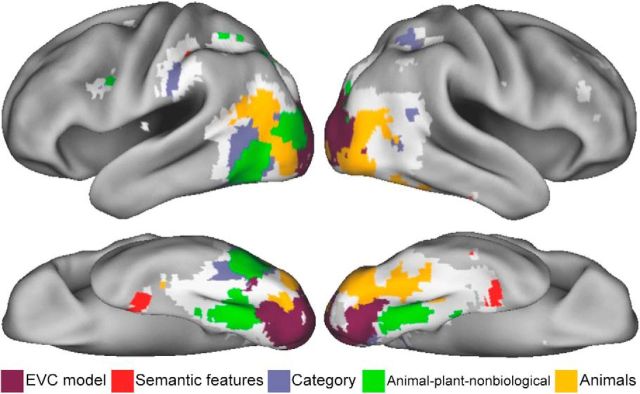
Figure 6.
Summary of the main findings. Representational topographic map showing significant unique effects of each theoretical model RDM. If significant effects were seen for more than one model, the model with the highest partial Spearman's correlation is shown. Regions that showed significant effects in the original analysis (Fig. 3) that did not show effects in the partial correlation analysis are shown in white. These regions show shared effects across multiple models.

