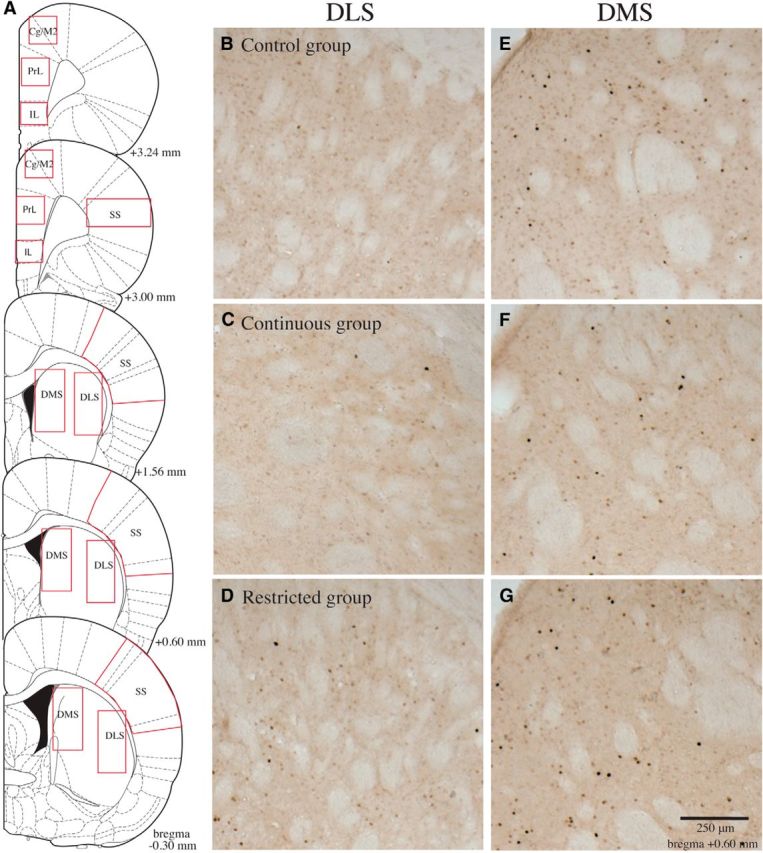
Figure 3.

Representative c-Fos IR in the DS and associated cortical regions. A, Schematic representation of the cortical and striatal regions where cell counts were performed (adapted from Paxinos and Watson, 2005). B–G, Representative c-Fos IR in the DLS (B–D) and DMS (E–G) for rats in the control, continuous-access, and restricted-access groups, respectively. It can be seen that in the DLS rats in the restricted group had higher c-Fos IR than rats in the other two groups, while no such differences were seen in the DMS. The results are quantified in Figure 4.
