


Figure 2.
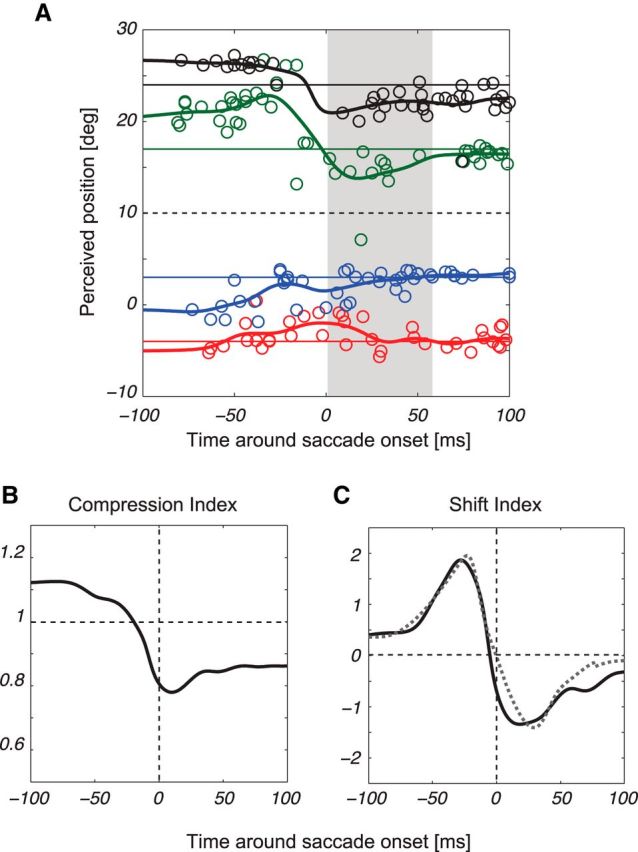
Representative data. Perceived positions of a briefly flashed bar are plotted with respect to saccade onset, shown here for a representative patient (A). The black hatched line in each plot indicates the ST position, and the gray area represents the average saccade duration (55 ms). Data points (each color indicating a different bar position) represent responses for the four bar positions. Position lines were calculated as running averages for each bar position, smoothed with a Gaussian filter (σ = 10 ms). Compression (B) and shift (C) indices are shown for the participant in A, where the gray dashed line in C indicates the CD recovered by the model.