
Figure 4.
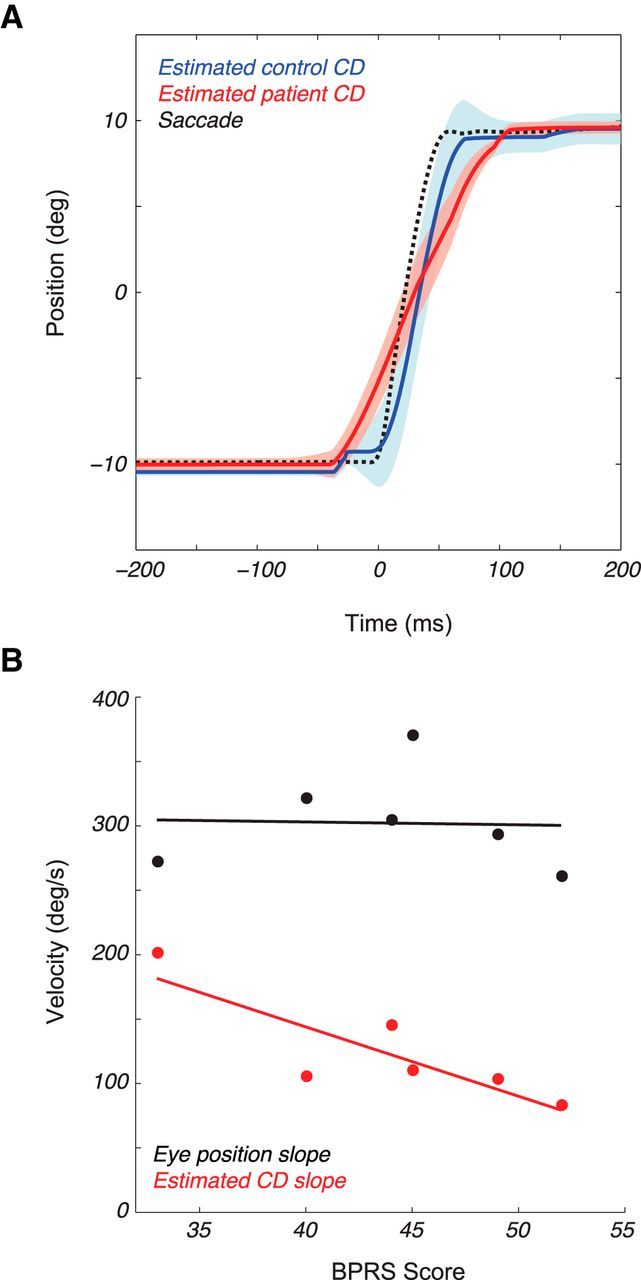
Modeling results. A, Average 20° saccade (black hatched line) with overlaid CD signals (mean ± SEM) for controls (blue) and patients (red) as recovered from the model. B, The slopes of the CD (red) and mean actual eye position (black) versus patient BPRS scores (points, n = 6).