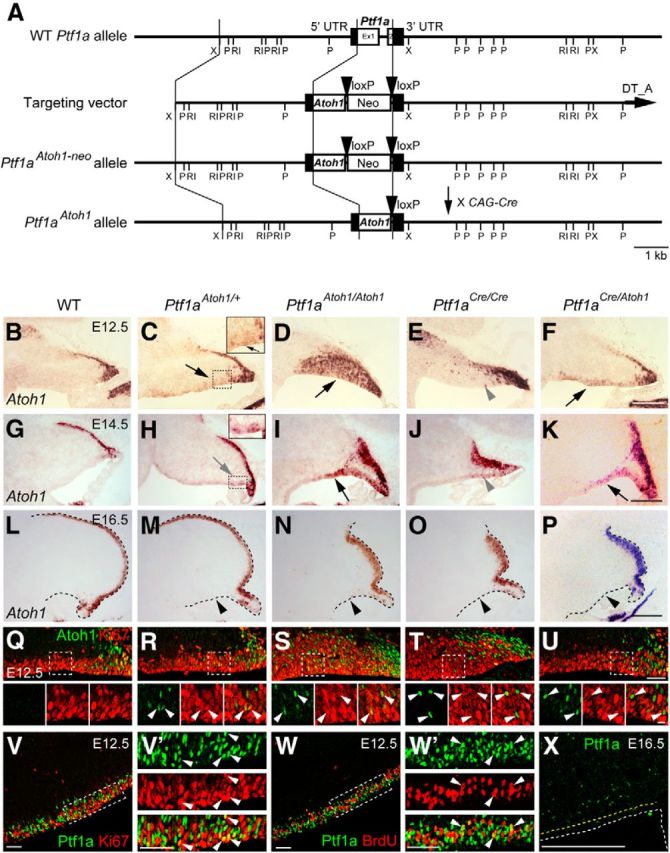
Figure 1.

Expression of Atoh1 and Ptf1a in the cerebellar primordium at embryonic stages. A, Generation of Ptf1aAtoh1 knock-in mouse line. Diagram showing Ptf1a wild-type allele, targeting construct, Ptf1aAtoh1-neo, and Ptf1aAtoh1 knock-in alleles. The pgk–neo cassette of the Ptf1aAtoh1-neo mice was removed by crossing with CAG–Cre mice. Boxes in wild-type Ptf1a allele represent noncoding (black) and coding (white) Ptf1a exon sequences. Black arrowheads represent loxP sequences. Ex, Exon; Neo, neomycin-resistance gene under the control of the pgk promoter; P, PstI; RI, EcoRI; X, XbaI. B–X, Sagittal sections of cerebella of indicated genotypes at indicated embryonic stages. Top is dorsal, and left is rostral. B–P, Atoh1 transcripts (in situ hybridization) visualized by in situ hybridization probe that detects both endogenous and exogenous Atoh1 transcripts. Black and gray arrows and gray arrowheads indicate cells that expressed Atoh1 ectopically in the VZ. Black arrowheads indicate the disappearance of ectopic Atoh1 expression in the VZ at later stages. Q–U, Expression of Atoh1 and Ki67 in the VZ at E12.5. Arrowheads indicate colocalization of Atoh1 and Ki67. V–W′, Expression of Ptf1a and markers (Ki67 or BrdU) is visualized by immunostaining. BrdU was administered 30 min before fixation. V′, W′, High magnification of boxed regions in V and W, respectively. Arrowheads indicate coexpression of Ptf1a and markers in the VZ. X, Ptf1a expression in the cerebellar primordium at E16.5. Yellow dotted lines indicate the edges of the VZ. WT, Wild-type. Scale bars: B–P, X, 200 μm; Q–W′, 50 μm; small panels at bottom in Q–U, 10 μm.
