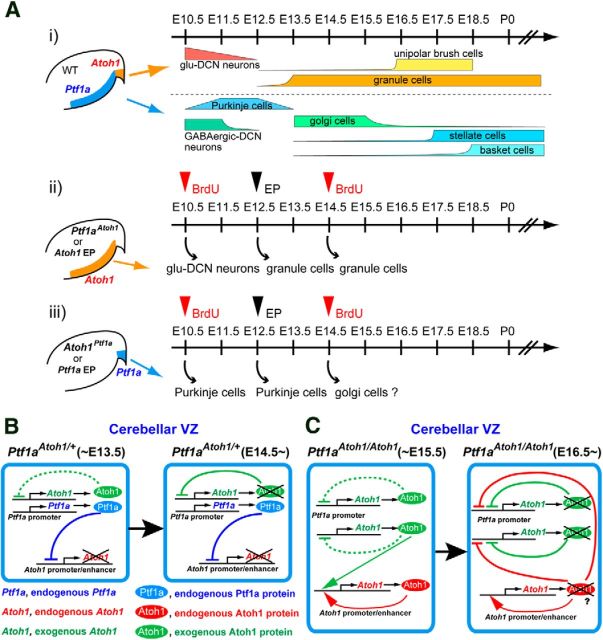
Figure 11.
Schematic models of Atoh1 and Ptf1a function and expression in the cerebellar neuroepithelium. Ai, Temporal schedule of the neurogenesis in the cerebellar primordium of wild-type mice drawn according to previous studies. Aii, Aiii, Summary for the birthdates of ectopically produced neurons in the knock-in mice or electroporated mice that ectopically express Atoh1 (Aii) and Ptf1a (Aiii). Red arrowheads indicate BrdU administration at E10.5 or E14.5 to the knock-in mice. Black arrowheads indicate electroporation with Atoh1 or Ptf1a at E12.5 to the wild-type VZ or RL, respectively. B, C, Schematic models for Ptf1a and Atoh1 expression in the cerebellar VZ of Ptf1aAtoh1 heterozygotes and homozygotes. Left and right boxes represent cells in the VZ at indicated stages. WT, Wild-type; EP, electroporation; KI, knock-in.

