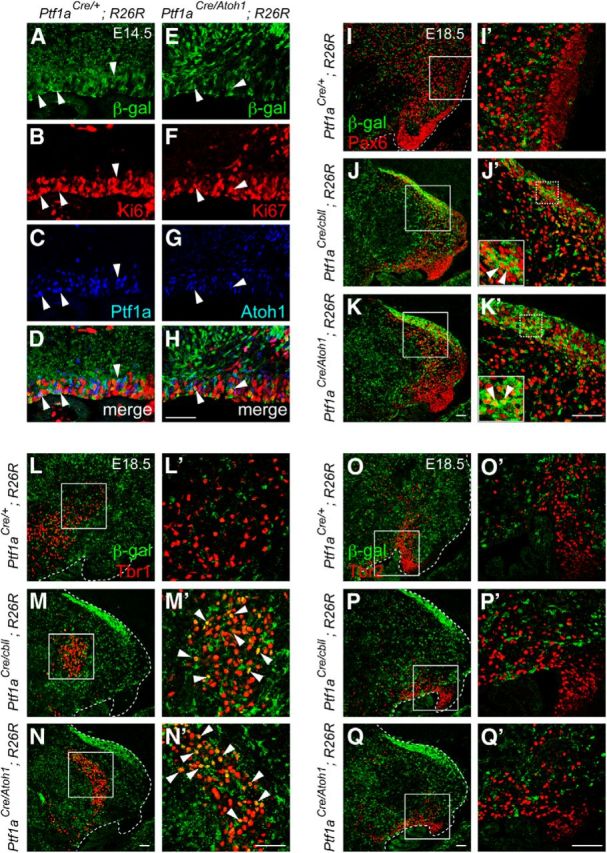
Figure 3.

Lineage tracing analysis in the cerebellum of the Ptf1aAtoh1 knock-in mice. A–H, Localization of β-gal (A, E), Ki67 (B, F), and Ptf1a (C) or Atoh1 (G) in the cerebellar VZ of indicated genotypes at E14.5. Arrowheads indicate triple localization of β-gal, Ki67, and Ptf1a or Atoh1. I–Q′, Sagittal sections of indicated genotypes at E18.5. Double immunostaining with β-gal (green) and cell type-specific markers (red), such as Pax6 (I–K′), Tbr1 (L–N′), and Tbr2 (O–Q′) was performed. I′–Q′, High magnification of boxed regions in I–Q, respectively. Arrowheads indicate colocalization of β-gal and a specific marker. Scale bars, 50 μm.
