
Figure 6.
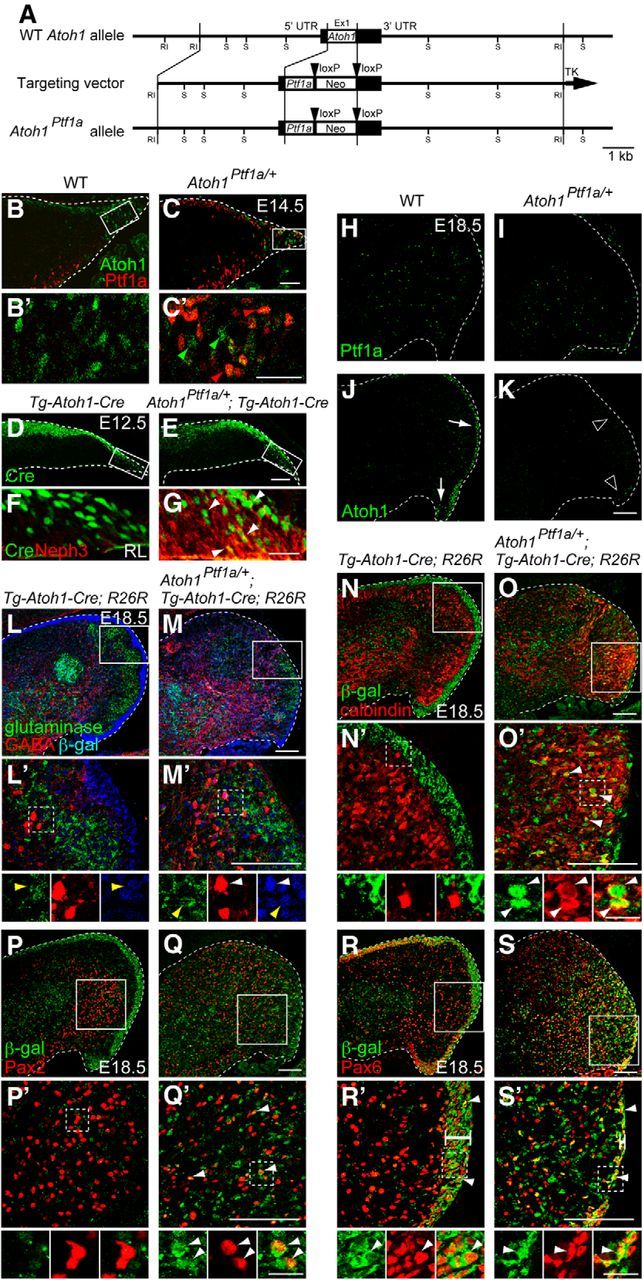
Lineage tracing analysis of cells produced from the RL that ectopically expresses Ptf1a. A, Generation of Atoh1Ptf1a knock-in mouse line. Diagram showing Atoh1 wild-type allele, targeting construct, and Atoh1Ptf1a mutant alleles. Boxes in wild-type Atoh1 allele represent noncoding (black) and coding (white) Atoh1 exon sequences. Black arrowheads represent loxP sequences. Ex, Exon; Neo, neomycin-resistance gene under the control of the pgk promoter; RI, EcoRI; S, SacI. B–K, Localization of Ptf1a, Atoh1, Cre, and Neph3 proteins in the cerebellar primordium of embryos of indicated genotypes at E14.5 (B–C′), E12.5 (D–G), and E18.5 (H–K). C′, Green and red arrowheads show Atoh1 and Ptf1a expression in the RL, respectively. F, G, Cre and Neph3 expression in the rectangular regions in D and E, respectively. White arrowheads in G show colocalization of Cre and Neph3 in the RL. L–M′, Triple immunostaining with β-gal (blue), GABA (red), and glutaminase (green). Yellow and white arrowheads indicate colocalization of β-gal with glutaminase and GABA, respectively. N–S′, Double immunostaining with β-gal (green) and cell type-specific markers (red), such as calbindin (N–O′), Pax2 (P–Q′), and Pax6 (R–S′). B′, C′, L′–S′, High-magnification pictures of boxed regions in B, C, and L–S, respectively. Small panels below L′–S′ are single colored or merged pictures corresponding to the rectangular regions in L′–S′. White bars in R′ and S′ indicate the width of the EGL. All are sagittal sections. Top is dorsal, and left is rostral. WT, Wild-type. Scale bars: B–E, 50 μm; B′, C′, F, G, 25 μm; H–S′, 100 μm; high-magnification views in L′–S′, 20 μm.