
Figure 6.
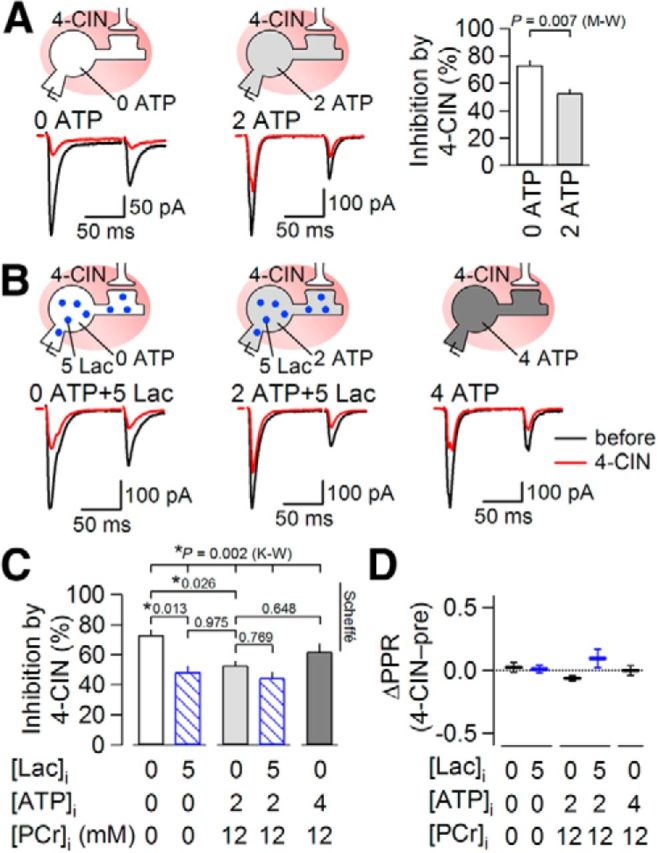
Effects of intracellular energy supply on synaptic suppression by 4-CIN. A, Averaged eEPSC waveforms (n = 8) evoked by paired-pulse stimulation before (black) and during (red) 4-CIN (1 mm) application in the absence (left) and presence (middle) of intrapipette ATP. Right graph shows summary effects of 4-CIN on eEPSC amplitude in the absence (left bar) and presence (right bar) of intrapipette ATP (0 ATP, n = 8; 2 ATP, n = 9). There was a significant difference in the inhibition by 4-CIN of eEPSC amplitude between in the absence and presence of intracellular ATP (Mann–Whitney U test; M-W). B, Averaged eEPSC waveforms (n = 8) before (black) and during (red) 4-CIN (1 mm) application in the absence (left) and presence (middle and right) of intrapipette ATP. Lactate (5 mm) was added into the patch pipette (left and middle). C, Summary of the effects of 4-CIN in the absence and presence of intracellular ATP and lactate on eEPSC amplitude (0 ATP, n = 8; 0 ATP + 5 Lac, n = 6; 2 ATP, n = 9; 2 ATP + 5 Lac, n = 6; 4 ATP, n = 8). The data for 0 ATP and 2 ATP without lactate are the same as in A and duplicated here to show the results of multiple comparisons. K-W, a result of statistical comparisons with Kruskal–Wallis multiple-comparison test, which was followed by pairwise comparison between groups with Scheffé comparison. The values show p values and *p < 0.05. Data are presented as the mean values ± SEM. D, Summary of change in PPR by 4-CIN in the absence and presence of intracellular ATP and lactate. Horizontal and vertical bars indicate the mean values and SEM.