
Figure 7.
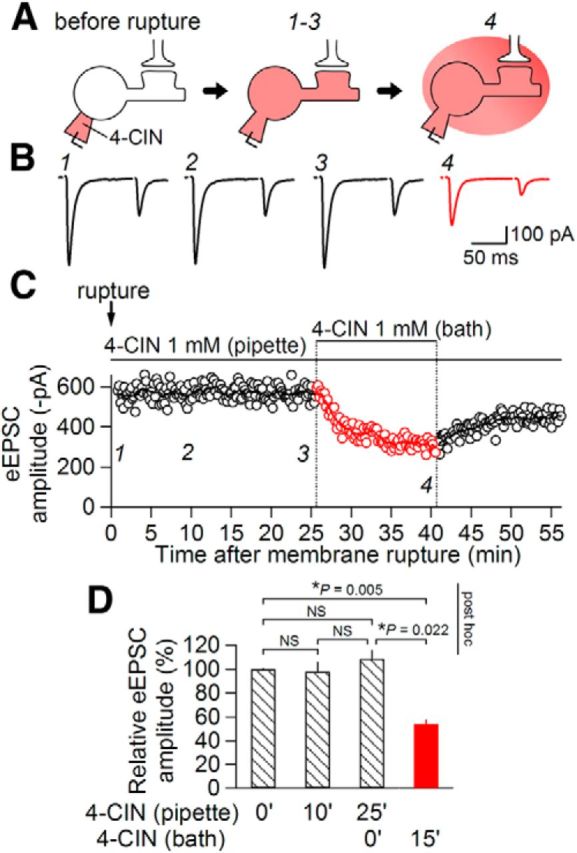
Extracellular site of action of 4-CIN. A, A schematic of the experimental protocol. B, Averaged eEPSC waveforms (n = 8) evoked by paired-pulse stimulation after membrane rupture at 0 (1), 10 (2), and 25 min (3) and during (4) bath application of 4-CIN (1 mm); 4-CIN was intracellularly applied by adding 4-CIN (1 mm) to the internal solution. C, Time course of eEPSC amplitudes (open circles, the amplitude of each eEPSC1; line, moving average over nine consecutive responses). D, Summary of the effects of pipette and bath application of 4-CIN on eEPSC amplitude. Values and “NS” indicate the results of Friedman test for repeated measurements. There was a significant difference (p = 0.004) among groups. p values above the graph show the results of post hoc pairwise comparison between pairs indicated with brackets. NS, not significantly different; n = 6. Data are presented as the mean values ± SEM.