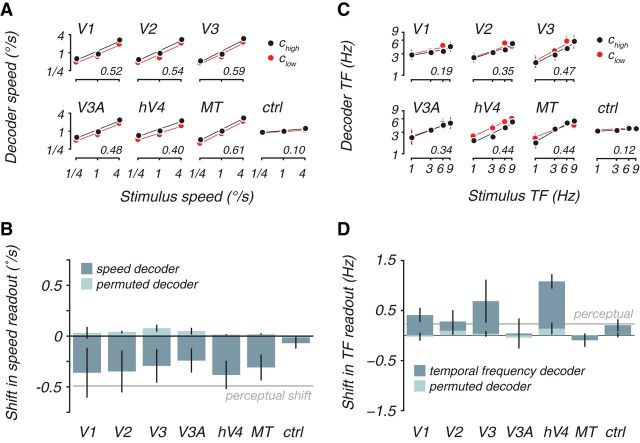
Figure 3.
Cortical decoders and perception were both biased in the same direction at low contrasts. A, Cross-validated decoder output as a function of stimulus speed, separately for high-contrast (black) and low-contrast (red) test stimuli. Decoder was trained for each subject and visual area, blind to contrast. For this, and all subsequent plots, decoder output is corrected with a scale factor to transform it to stimulus units (degrees per seconds; see Materials and Methods, Decoders). Lines are linear fits. Inset numbers indicate the average cross-validated decoder accuracy across subjects, computed as the correlation between the actual speed and the cross-validated decoder prediction. B, Average decoder and perceptual shift between high and low contrast for speed. Dark bars plot shift in decoder output between high and low contrast computed as the vertical distance between the linear fits in A. Decoder contrast shifts were defined as the mean difference in the decoder speed estimates between trials with high- and low-contrast stimuli for the same stimulus speed, in which negative numbers indicate a shift toward slower speeds at low contrast. No consistent shift was seen using decoders with permuted weight vectors (light bars). Average perceptual shifts from the psychophysical experiment for these two contrasts (−0.49°/s, gray line) was also toward slower speeds at lower contrast. C and D depict analogous measures for temporal frequency, in which the perceptual bias (gray line) was 0.23 Hz. ctrl, Control; TF, temporal frequency.

