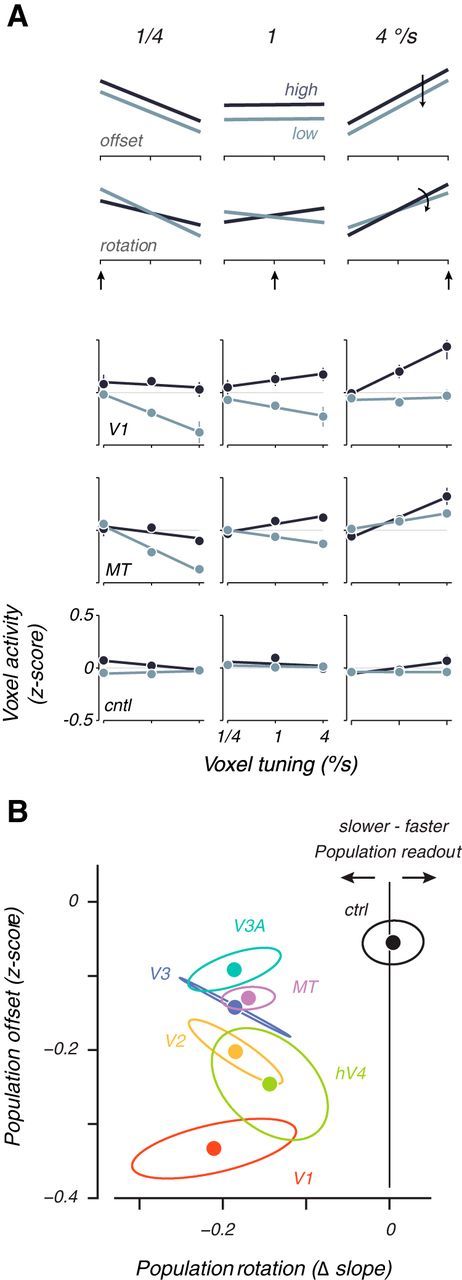
Figure 4.

Voxel population analysis of speed shifts. A, Normalized voxel response is plotted as a function of voxel tuning preference for two hypothetical cases (top 2 rows) and three areas averaged across all subjects (bottom 3 rows). Each columns shows activity at one of three different stimulus speeds at high (dark lines) or low (light lines) contrast. The arrow indicates a slow, medium, or fast stimulus speed. Data are cross-validated and averaged across all trials and subjects, reported as z-scores. Error bars are SEM across subjects. A hypothetical general decrease in contrast would shift population activity vertically without changing the slope (first row: “offset”), whereas a hypothetical population shift to slower speeds at low contrasts should result in a rotation of the population response (second row: “rotation”). B, Plot of vertical offset against rotation of population activity lines, averaged across subject for each visual area. Ellipses are SEM across subjects. Clockwise (negative) rotations of the population activity lines as a result of low-contrast stimuli can be interpreted as a shift in the speed representation toward slower speeds. Counterclockwise (positive) rotations can be interpreted as a shift toward higher speeds. cntl, ctrl, Control.
