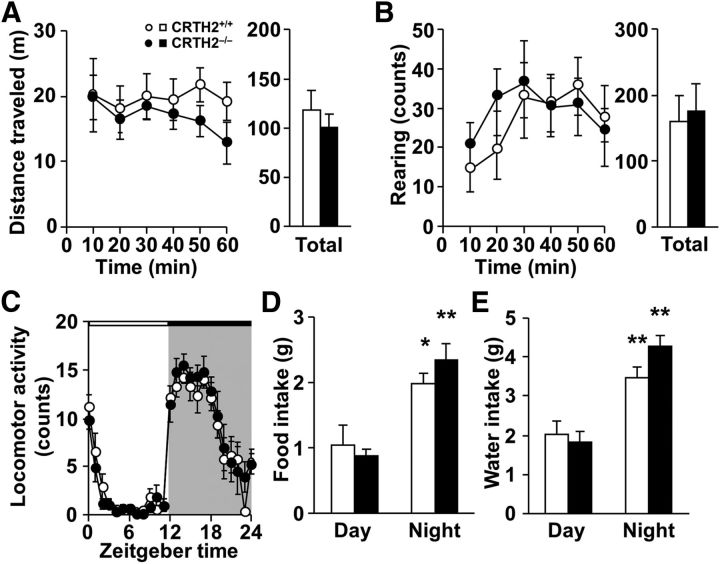
Figure 1.
SHIRPA secondary screening in CRTH2−/− mice. A, Distance traveled in open-field test. Bar graph shows total distance traveled during 60 min (n = 9–10). B, Rearing counts in open-field test. Bar graph shows total counts of rearing during 60 min (n = 9–10). C–E, Circadian changes in locomotor activity (C; n = 8), food intake (D; n = 12), and water intake (E; n = 12). White and black horizontal bars indicate day and night, respectively (C). Open symbols and columns, CRTH2+/+ mice; closed symbols and columns, CRTH2−/− mice. Data are expressed as means ± SEM; *p < 0.05, **p < 0.01 versus day time by two-way ANOVA followed by Tukey–Kramer test.

