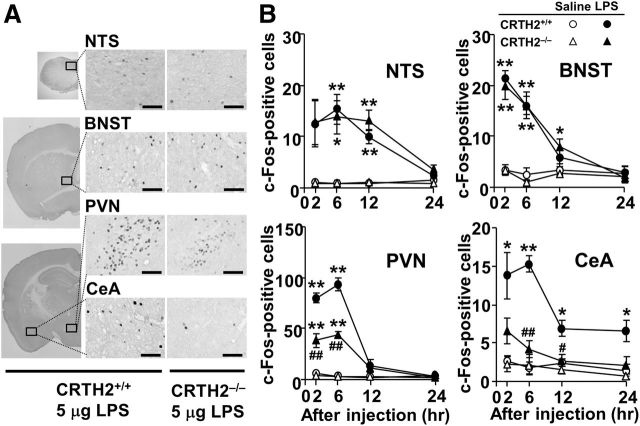
Figure 6.
LPS-induced c-Fos expression is attenuated in the PVN and CeA in CRTH2−/− mice. A, Representative photomicrographs showing c-Fos labeling in the NTS, BNST, PVN, and CeA of CRTH2+/+ (left and middle, lower and higher magnification images, respectively) and CRTH2−/− mice (right, higher magnification images), 6 h after LPS injection. Scale bars: 100 μm. B, The number of c-Fos-positive cells in the NTS, BNST, PVN, and CeA of CRTH2−/− (triangles) and CRTH2+/+ (circles) mice intraperitoneally injected with 5 μg LPS (closed symbols) or saline (open symbols). Data are expressed as the mean ± SEM (n = 3); *p < 0.05, **p < 0.01 versus saline, #p < 0.05, ##p < 0.01 versus CRTH2+/+ mice by three-way ANOVA followed by Tukey–Kramer test.

