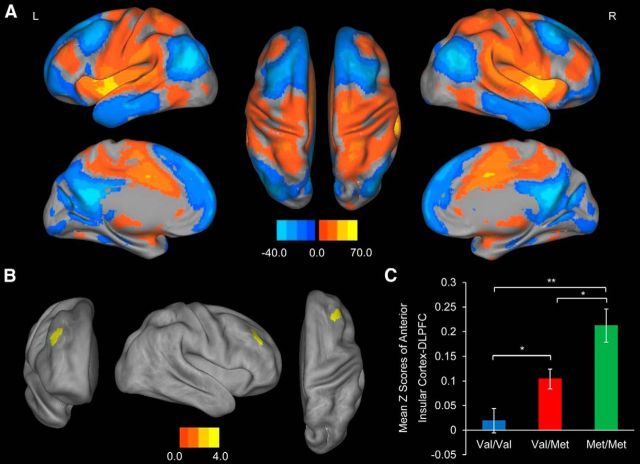
Figure 2.
Association of BDNF Val66Met with functional connectivity in resting-state networks. A, Resting-state functional connectivity pattern between the significantly associated region of the cortical surface area and the rest of the brain across all subjects (FWE-corrected p < 0.01). Red color represents positive connectivity; and blue represents negative connectivity. L, Left; R, right. B, The right DLPFC shows a significant linear increase in coupling with the ROI (Val/Val < Val/Met < Met/Met). The color bar indicates T-scores (FWE-corrected at cluster level, p < 0.05). C, Mean ± SEM functional connectivity between the ROI and the DLPFC in Figure 2 across all subjects. *p < 0.01 (two-sample t test). **p < 0.001 (two-sample t test).

