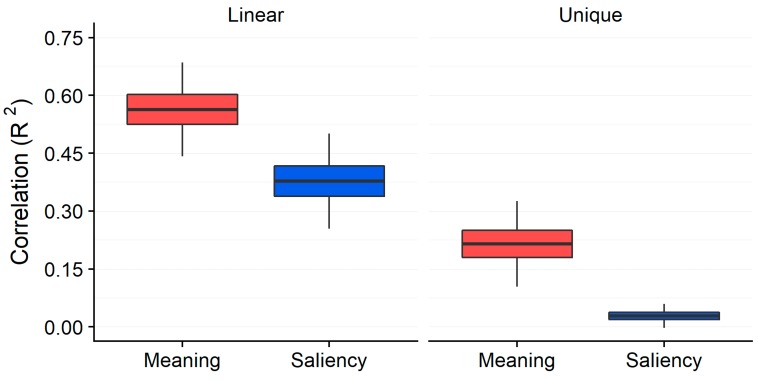
Figure 4.
Squared linear correlation and semi-partial (unique) correlation for meaning and image salience across 40 scenes from a scene memorization task in Henderson and Hayes (2017) [42]. Box plots show the grand mean (black horizontal line), 95% confidence intervals (colored box), and one standard deviation (black vertical line).

