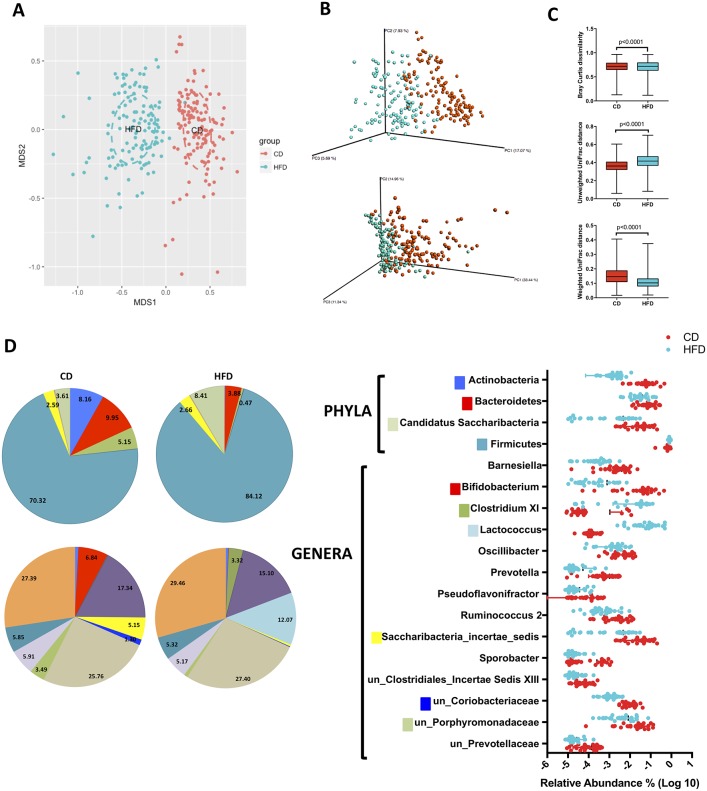
Fig 3. High fat diet causes shifts in the gut microbiomes of BXD.
Clustering of samples by NMDS of Bray Curtis dissimilarity (A) and principal coordinates analysis (PCoA) of Unweighted and Weighted Unifrac distances (B) show a shift in the microbial communities of the gut in the BXD mice caused by the HFD. Analysis of β-diversity metrics show statistically significant differences between the dietary treatments (C). Pie charts and graph show relative abundance (D) of taxa present in both strains at the phylum and genus level. Taxa whose abundance was lower than 1% were grouped in the pie chart. Only statistically significant taxa (p<0.05) are shown in graph on right. un_: unclassified Statistics: Multiple t-test, lines and bars represent mean and standard deviation.

