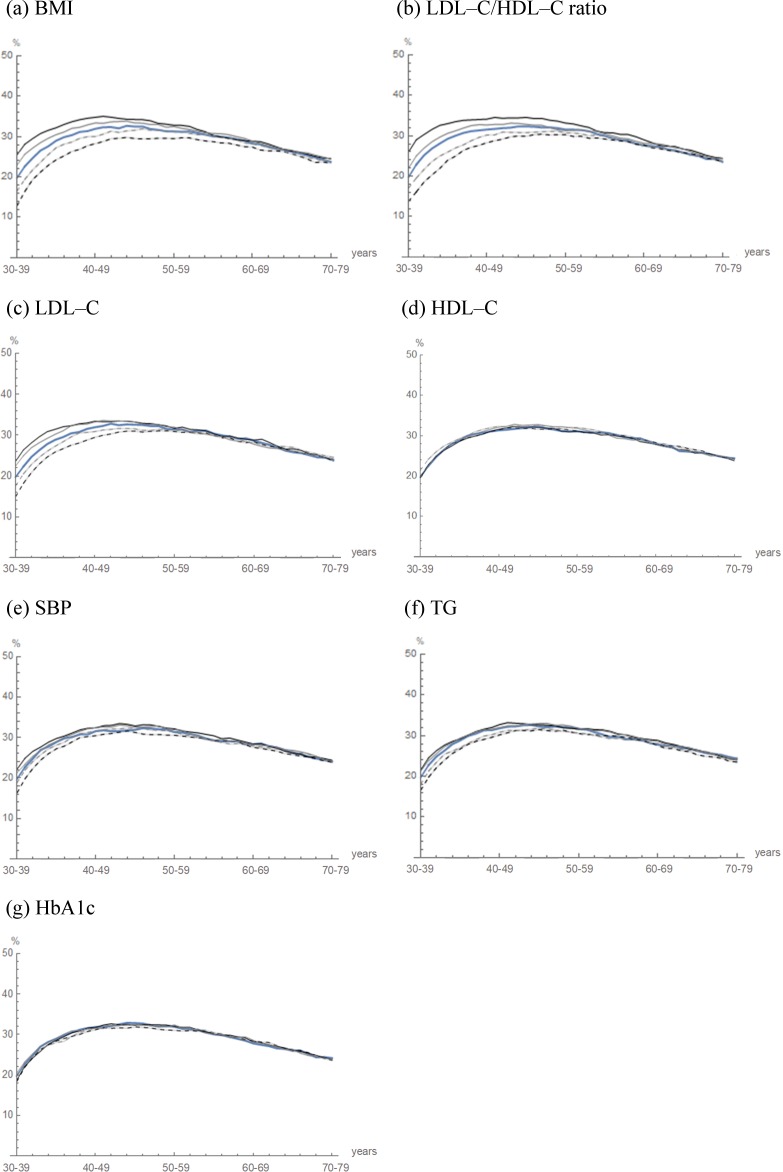
Fig 4. Simulated life–course of fatty liver with variations by changes in the clinical and biochemical predictor variables of cohort 2.
The trajectories of the projected prevalence in cohort 2 (blue curve) are illustrated. The initial proportion of the clinical and biochemical predictor variables of cohort 2 were varied by −40% (dashed black curve), −20% (dashed gray curve), 20% (gray curve) and 40% (black curve).

