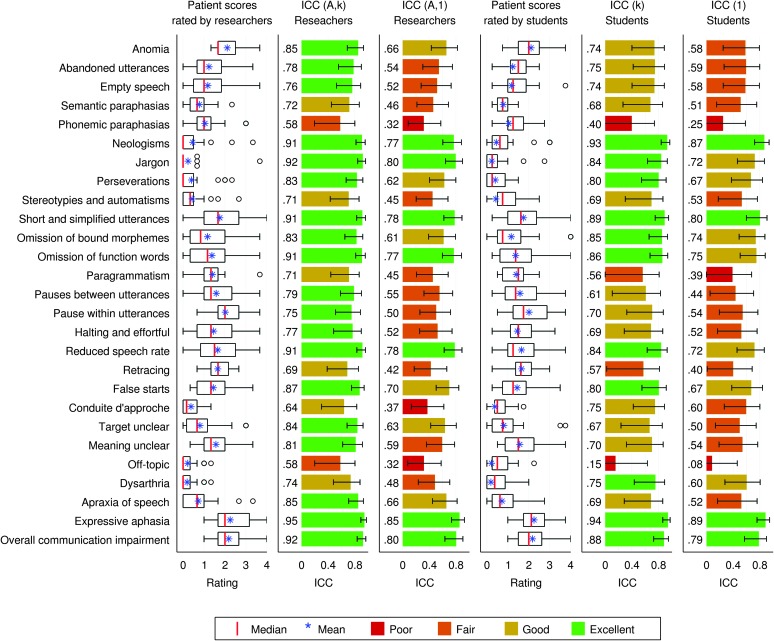
Figure 1.
Distribution and interrater reliability of the 27 connected speech features. Each row shows one connected speech feature. The first column shows the distribution of the 24 patients' scores, where each patient's score is the mean of the three researchers' ratings. Boxes: interquartile ranges; whiskers: ranges excluding outliers; circles: outliers; red lines: medians; blue asterisks: means. The second column shows the intraclass correlation coefficient (ICC), type A,k for the three researchers. This is the expected correlation between scores averaged across the three researchers, and scores averaged across three different hypothetical researchers from the same population of researchers. Error bars indicate 95% confidence intervals. The third column shows the ICC, type A,1, for the three researchers. This is the expected correlation between pairs of researchers from the population of researchers. The fourth column shows the distribution of the 24 patients' scores, where each patient's score is the mean of four student ratings (only four of the 12 students rated each patient). Red lines: medians; blue asterisks: means; black circles: outliers. The fifth column shows the ICC, type 1,k, for the students. This is the expected correlation between scores averaged across four students, and scores averaged across a different set of four students, with all students drawn at random from the population of students. The sixth column shows the ICC, type 1, for the students. This is the expected correlation between pairs of students from the population of students.

