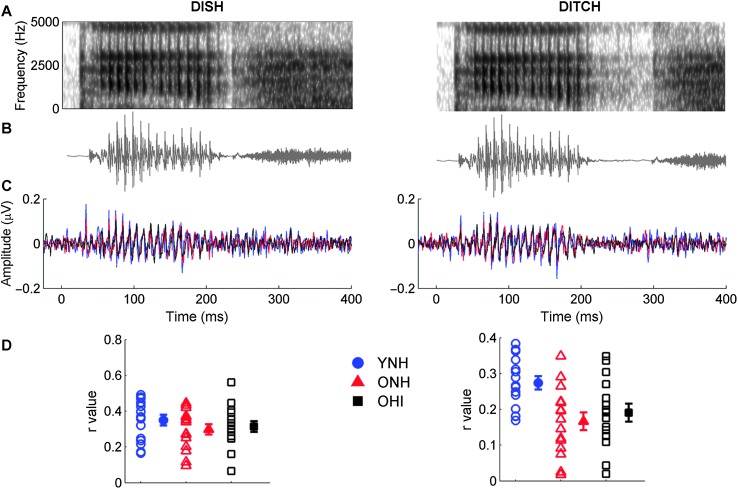
Figure 3.
Spectra (A) and waveforms (B) for DISH (0-ms silence duration; left column) and DITCH (60-ms silence duration; right column) stimuli. (C) Average response waveforms in the time domain to DISH and DITCH for younger listeners with normal hearing (YNH; blue), older listeners with normal hearing (ONH; red), and older listeners with hearing impairment (OHI; black). The periodicity of the stimuli, representing the 9.1-ms period of the 110-Hz F0, is mirrored in the average response waveforms. No group differences were observed to the speech token DISH. Younger listeners, however, demonstrated better approximations to the stimulus waveform for DITCH than did either group of older listeners. (D) Individual (open symbol) and group average (closed symbol) stimulus-to-response correlation r values displayed for DISH and DITCH. Error bars indicate ± 1 SE.

