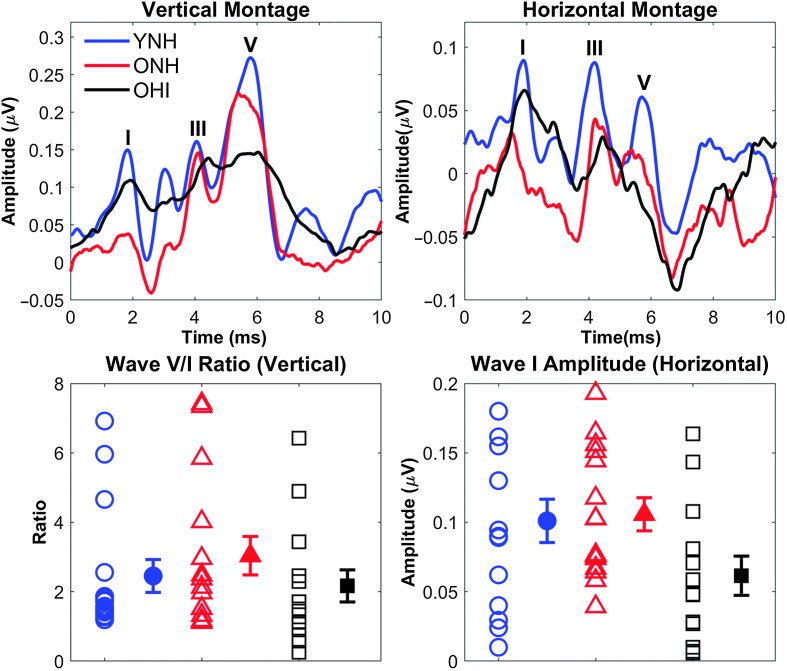
Figure 8.
Top: Average auditory response waveforms to a 100-μs click in younger listeners with normal hearing (YNH; blue), older listeners with normal hearing (ONH; red), and older listeners with hearing impairment (OHI; black) participants using a vertical montage (left) and a derived horizontal montage (right). The major peaks are labeled as I, III, or V. Bottom: The Wave V/I ratio from the vertical montage (left) and the Wave I amplitude from the derived horizontal montage (right) are quantified. No significant group differences were found, but considerable individual variability was observed as can been seen in the large error bars. Error bars indicate ± 1 SE.

