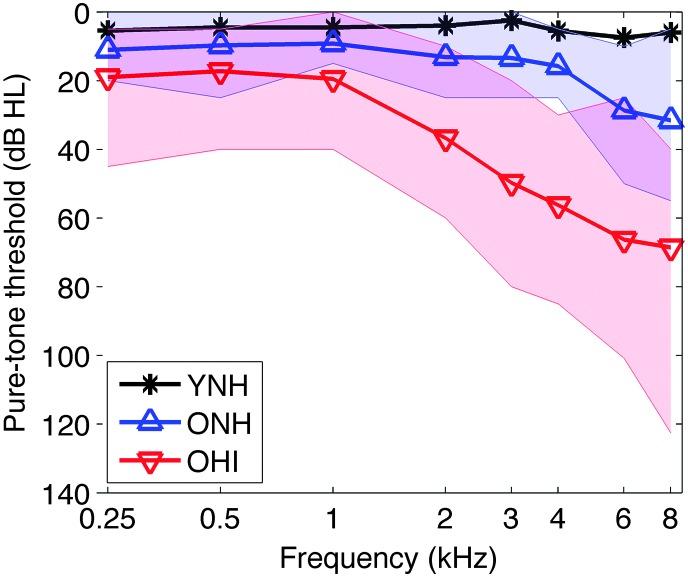
Figure 2.
Group-averaged pure-tone air-conduction audiograms. Mean pure-tone thresholds for the young normal-hearing (YNH; black), older normal-hearing (ONH; blue), and older hearing-impaired (OHI; red) listeners are indicated by bold lines. The threshold ranges for the ONH and OHI listeners are indicated by the blue- and red- shaded regions, respectively. The purple-shaded region indicates an overlap in the ONH and OHI ranges. Threshold ranges for the YNH listeners are not shown.

