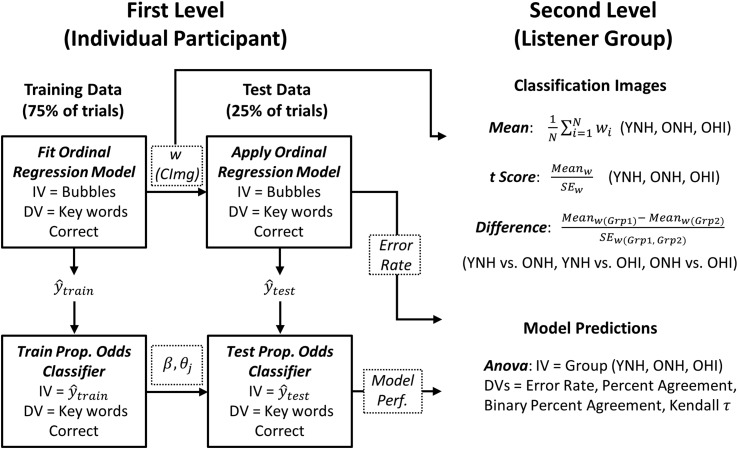
Figure 4.
Classification image analysis schematic. The goal of first-level analysis was to generate for each participant a CImg (w) using ordinal regression and to use the resultant CImg model to predict the participant's trial-by-trial responses (keywords correct) via a proportional odds classifier. Models were trained and tested on independent data. The CImg (w) and model performance metrics (error rate, percent agreement, binary percent agreement, and Kendall τ) were passed to the second level for further analysis. The goal of second-level analysis was to calculate a mean and t-score CImg for each listener group (YNH, ONH, and OHI) and to test for differences in the group level CImg statistically (difference t score). The listener group means of CImg model performance metrics were also compared statistically at the second level. IV = independent/predictor variable; DV = dependent/criterion variable; CImg = classification image; SE = standard error; YNH = young normal-hearing; OHI = older hearing-impaired; ONH = older normal-hearing.

