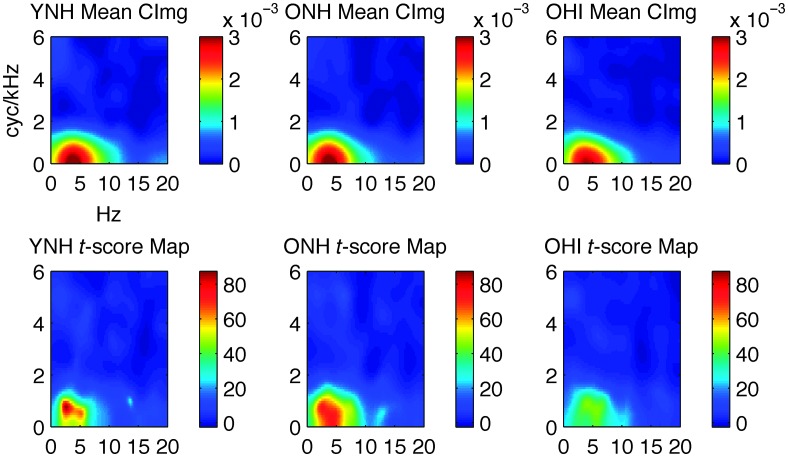
Figure 5.
Second-level CImgs. Top row: mean CImgs; color bar indicates ordinal regression weights. Bottom row: one-sample t-score images; color bar indicates t-score magnitude. Listener groups are labeled in the titles above each panel. Axis labels on the top left panel apply to all panels. Ordinate: spectral modulation rate (cyc/kHz). Abscissa: temporal modulation rate (Hz). CImg = classification image; YNH = young normal-hearing; OHI = older hearing-impaired; ONH = older normal-hearing.

