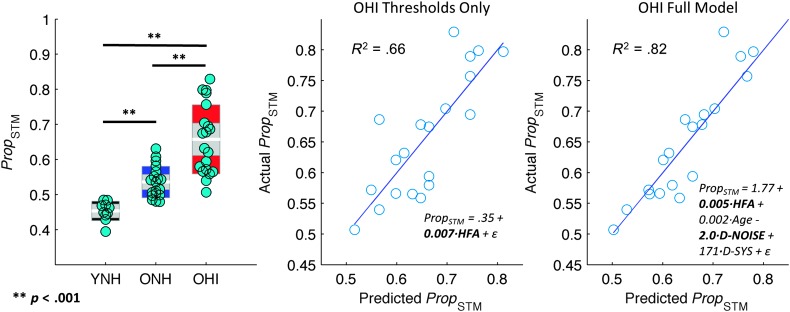
Figure 8.
Threshold behavioral performance (Prop STM, smaller = better performance) and relation to hearing status and classification image (CImg) model parameters in OHI listeners. Left: distribution plots showing the across-trial average proportion of STMs revealed to listeners in each group (YNH, ONH, and OHI). White horizontal bars show the group mean, gray shaded regions show the 95% confidence interval of the mean, and colored regions show the standard deviation. Cyan markers show the individual participant scores. Statistically significant differences between groups are marked by black bars. Middle: scatter plot of predicted threshold performance (abscissa) against actual threshold performance (ordinate) in OHI listeners for a model including high-frequency average (HFA) thresholds as a single predictor. Regression equation is shown along with the best-fitting regression line and model R 2. Significant predictors (p < .05) are bolded in the regression equation. Right: scatter plot of predicted threshold performance (abscissa) against actual threshold performance (ordinate) in OHI listeners for a model including HFA thresholds, age, CImg separability (D-NOISE), and the average magnitude of CImg weights in the “hot spot” (D-SYS). Regression equation is shown along with the best-fitting regression line and model R 2. Significant predictors (p < .05) are bolded in the regression equation. Model fit is improved when CImg parameters are included. YNH = young normal-hearing; OHI = older hearing-impaired; ONH = older normal-hearing; STM = spectrotemporal modulation.

