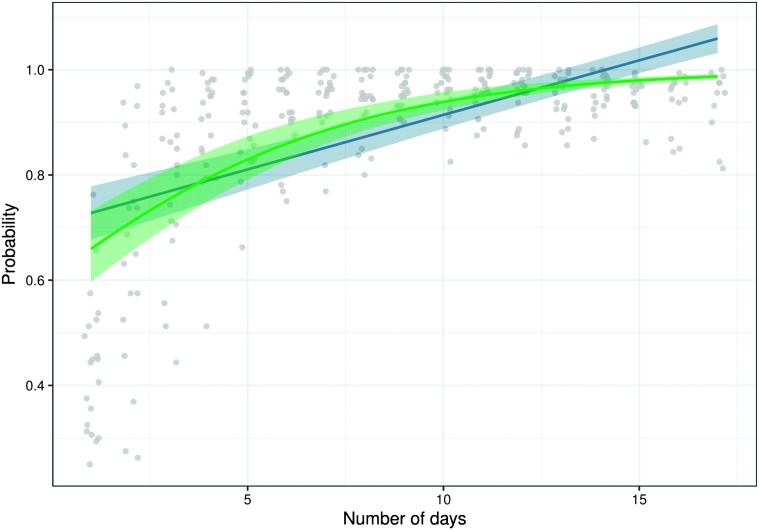
Figure 3.
Population probability curve π(t) and its 95% confidence interval estimated by a linear mixed-effects model applied to the empirical success probabilities in the speech learning experiment (blue) superimposed over estimates obtained by fitting a logistic linear mixed-effects model (green).

