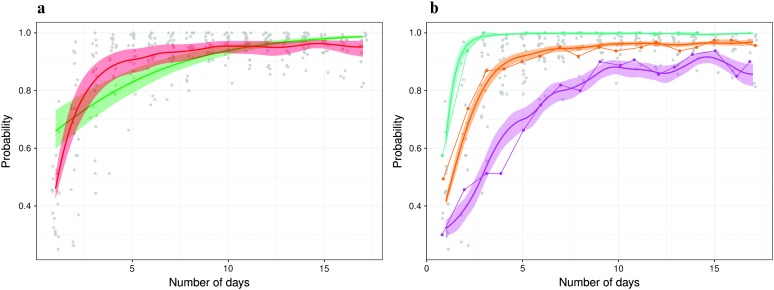
Figure 5.
(a) Estimated population probability curves π(t). The solid lines represent the estimates according to the logistic linear mixed-effects model (green) and the functional logistic mixed-effects model (FLMEM; red). The shaded areas are the 95% credible/confidence intervals for the mean function π(t). (b) Individual specific probability curves for three individuals and their 95% credible intervals, obtained using the FLMEM.

