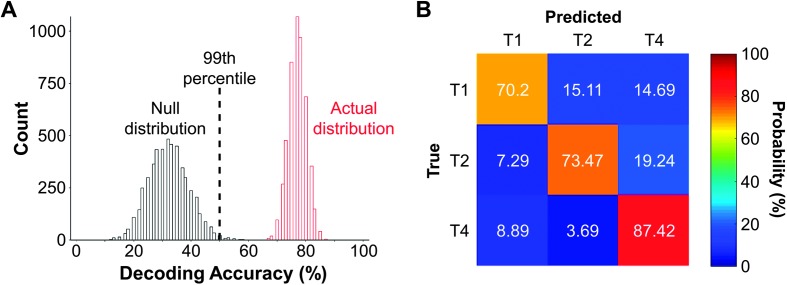
Figure 2.
An example of results for implementing a decoding model using linear support vector machines (SVMs) to analyze frequency-following responses (FFRs) to speech stimuli. The data were taken from Xie et al. (2018). (A) The left (black) histogram represents the null distribution of decoding accuracy (n = 5,000) derived from permutation tests. The right (red) histogram represents the distribution of the actual decoding accuracy (n = 5,000; actual distribution). The black vertical dashed line indicates the 99th percentile in the null distribution. If the median of the actual distribution is higher than the 99th percentile in the null distribution, it indicates that the actual decoding accuracy is statistically significant at an alpha value of .01. (B) A contingency table (also called confusion matrix) of the true versus predicted tone categories from the decoding analysis. Each column corresponds to the true tone category, and each row corresponds to the predicted tone category. The shade and the numbers of a given cell denote the occurrence of a predicted tone category in proportion to the total instances of a given true tone category (i.e., probability).

