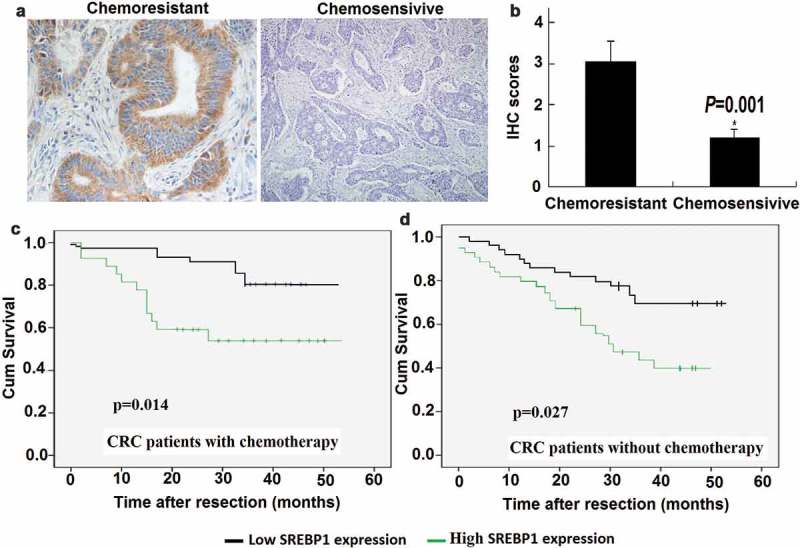
Figure 1.

Chemoresistant colorectal cancer samples express high levels of SREBP1. a, Representative image of immunohistochemical staining for SREBP1 in chemosensitive and chemoresistant colorectal cancer (CRC) samples. Scale bars: 100μm. b, Statistical analysis revealed IHC scores between the two groups were significantly different (P = 0.001). c, d, Kaplan-Meier survival curves of overall survival duration based on SREBP1 expression in CRC tissues. The receiver operating characteristic curve was used to define the cutoff, and log-rank analysis was used to test for significance.
