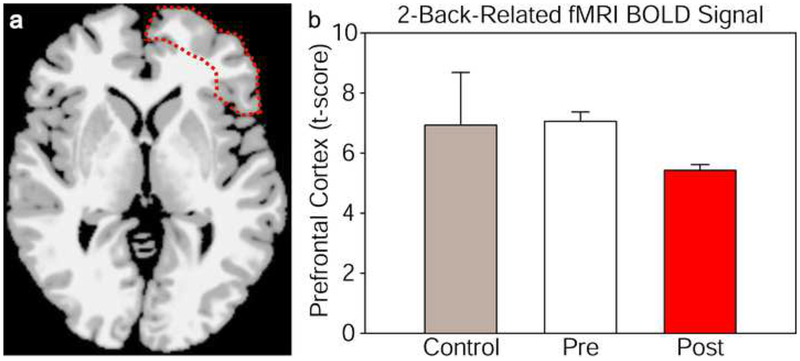
Fig. 5.
Right prefrontal cortex region with lower BOLD-fMRI responses to a 2-back vs. 0-back cognitive task compared between pre- and post-treatment with TILS to the right forehead (delineated area in a). The bar graphs b show the corresponding values of brain intensity signal (t-score) from this region, averaged between 3 treated subjects (pre- and post-treatment) and 3 untreated subjects (control). Bars show means plus standard errors

