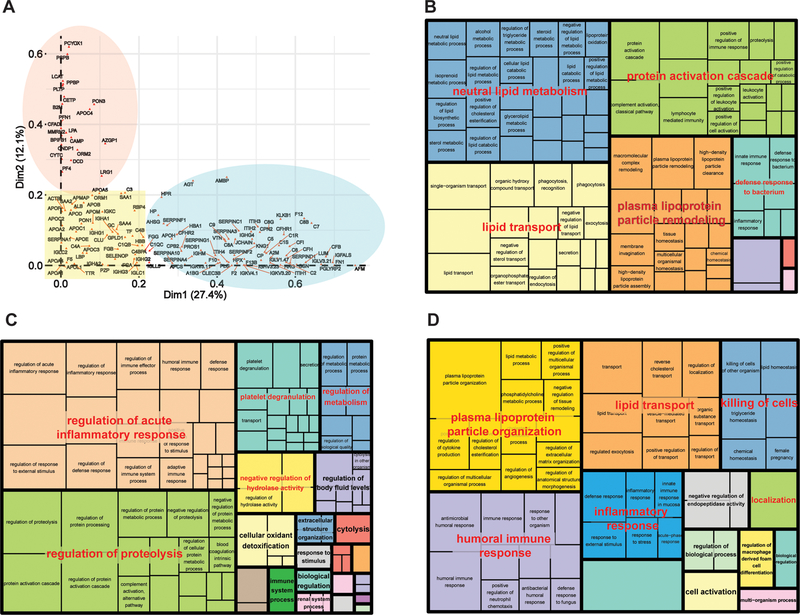
Figure 3.
MCA correlations and functional annotation analyses of proteins reported in HDL. A) Correlation analysis of the individual proteins within the first two principal components (Dim1 and Dim2) of MCA. The yellow square indicates the group of proteins with correlation < 0.2 with either dimension. Proteins highly correlated with Dim1 (correlation > 0.2) are highlighted in the blue ellipse, while proteins with correlation > 0.2 with Dim2 are highlighted by the red ellipse. B) Functional annotation analysis of proteins that do not contribute for variance in either dimension in MCA (correlations < 0.2 with Dim1 and Dim2). C) Functional annotation analysis of proteins with correlation > 0.2 with Dim1. D) Functional annotation analysis of proteins with correlation > 0.2 with Dim2.

