. 2019 Oct 21;8:e48216. doi: 10.7554/eLife.48216

Figure 2. Gene expression in ON and OFF bipolar cells.

Left, heatmap displaying 680 genes identified by bulk RNA-seq as differentially expressed between FACS-purified ON and OFF bipolar cell populations (current study) mapped onto single cell expression profiles for bipolar cell types identified by Drop-seq (Shekhar et al., 2016). Overall, genes identified as ON- or OFF-specific by bulk RNA-seq showed corresponding differential expression between ON and OFF bipolar types identified by Drop-seq. Right, Expression of the top 25 most differentially enriched genes (ranked by p-value) in OFF (top) and ON (bottom) bipolar populations presented as dot plots as in Shekhar et al. nTrans = mean number of transcripts expressed per cell in each cluster identified as a bipolar cell type; PercExpr = percentage of cells within each cluster found to express the indicated gene. Dot plots for all 680 differentially expressed genes are presented in Figure 2—source data 1.

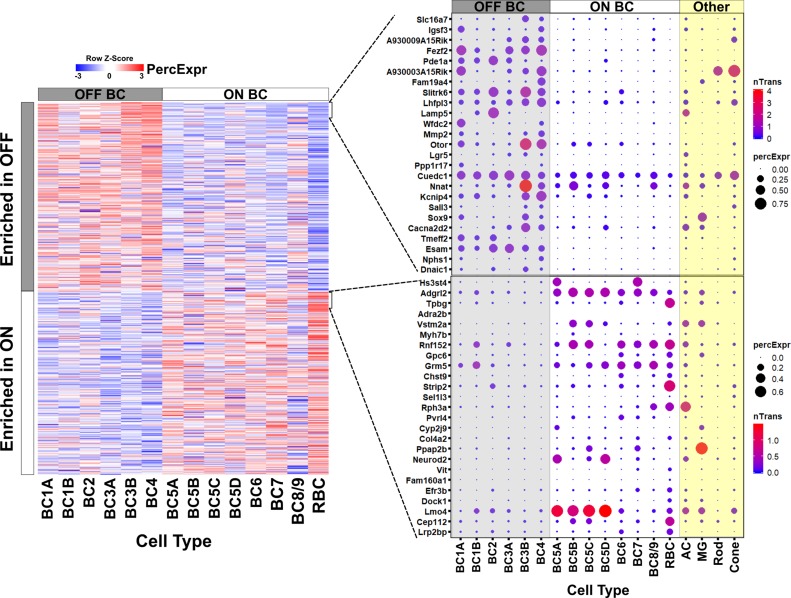
Figure 2—source data 1. Single-cell expression profiles of genes differentially expressed between ON and OFF bipolar cells.
Dot plots present single cell expression data obtained by Shekhar et al. (2016) using Drop-seq for genes identified in this study by bulk RNA-seq as differentially enriched in ON or OFF bipolar cells. Drop-seq data was available for 630 of the 680 genes, which are sorted by lowest adjusted p-value. (A-H) Genes enriched in OFF bipolar cells. (I-O) Genes enriched in ON bipolar cells. nTrans = mean number of transcripts expressed per cell in each cluster identified as a bipolar cell type. PercExpr = percentage of cells within each cluster found to express the indicated gene.
DOI: 10.7554/eLife.48216.008

Figure 2.

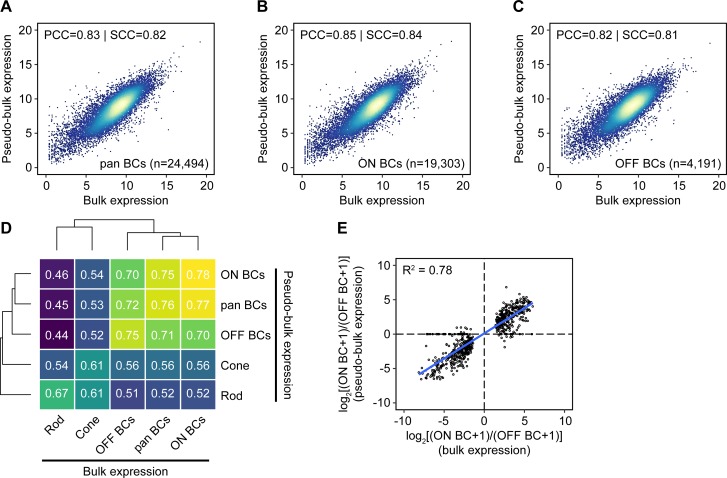
Figure 2—figure supplement 1. Comparison of gene expression measured by bulk RNA-seq and single-cell RNA-seq.

Figure 2—figure supplement 1.

(A–C) Gene expression for all, ON, and OFF BCs by bulk RNA-seq (x-axis) or aggregated from single-cell RNA-seq data from Shekhar et al. (2016) from clustered cells corresponding to the same populations (‘pseudo-bulk’, y-axis). Units are log2(normalized counts+1). The number of cells in each pseudo-bulk population (n) is shown. Genes with counts of 0 in bulk, pseudo-bulk, or both datasets are not shown (6,915, 11,916, and 6,851 for all BCs; 7,059, 11,920, and 7,002 for ON BCs; 6,985, 11,984, and 6,922 for OFF BCs). PCC: Pearson correlation coefficient. SCC: Spearman correlation coefficient. (D) Heat map of Spearman correlation coefficients between bulk and pseudo-bulk expression data (after filtering for genes with normalized counts ≥ 100 in≥1 cell type). Rows and columns are clustered hierarchically with average linkage. (E) Estimated log2 fold change calculated from bulk RNA-seq (x-axis) vs. single-cell RNA-seq (y-axis) for genes identified as differentially expressed in ON and OFF BCs by bulk sequencing.