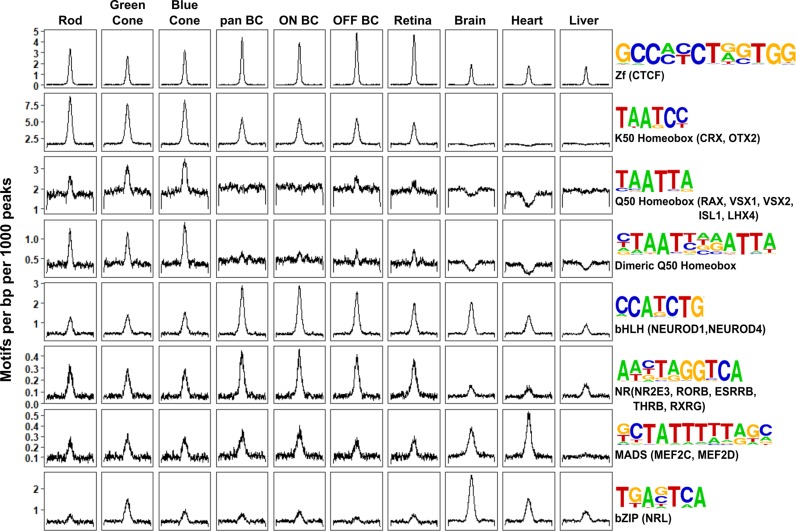
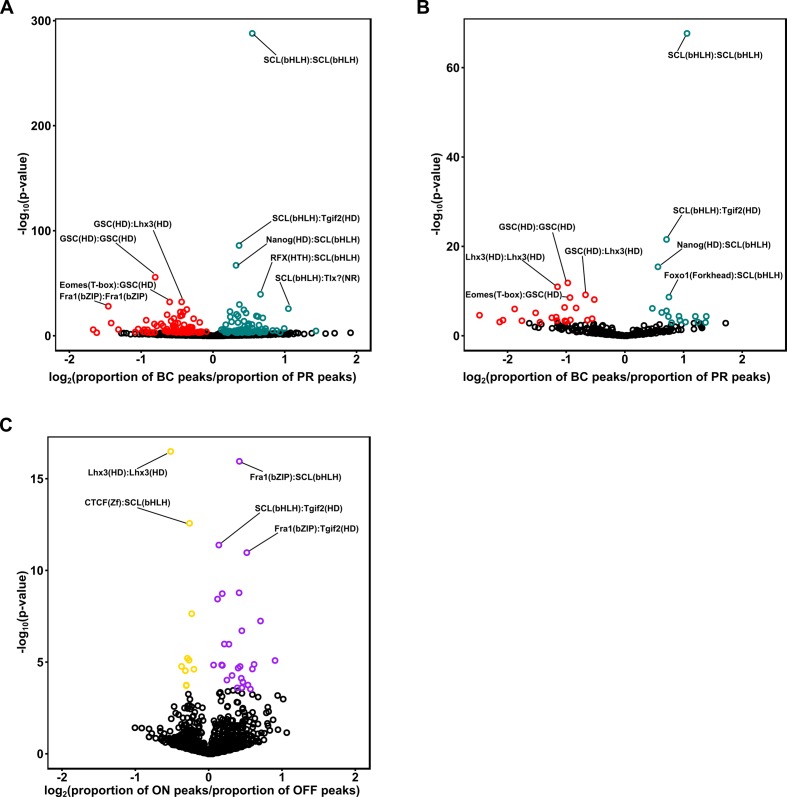
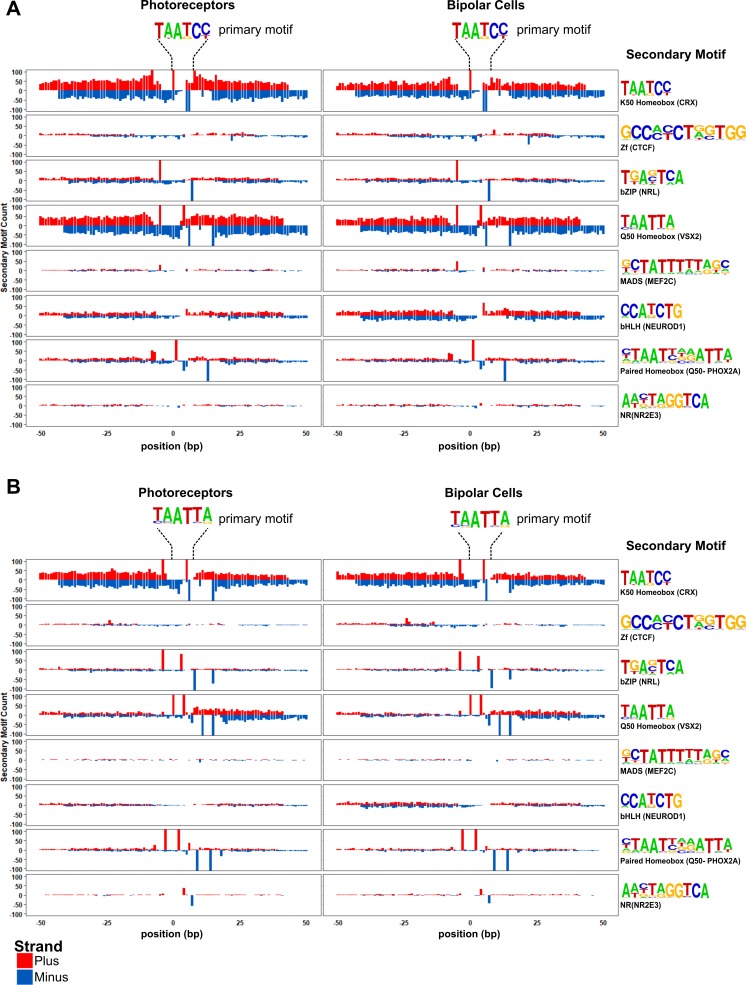
Figure 4. Patterns of TF binding site enrichment across retinal cell classes.
Motif enrichment patterns identified in bipolar and photoreceptor ATAC-seq datasets as well as in DNase-seq datasets from adult mouse whole retina, brain, heart, and liver. This analysis included all enhancer (i.e., TSS-distal) open chromatin peaks from each cell class or tissue. Each panel is centered on a 1 kb window around peaks from the indicated dataset. Motif density (motifs per base pair per 1000 peaks) is shown on the Y-axis. Consensus sequences for each motif class and example TFs (in parentheses) expressed in photoreceptors and bipolar cells are shown on the right. Photoreceptor and bipolar cell populations share enrichment for K50 HD motifs, while only photoreceptors show enrichment for Q50 HD motifs.


