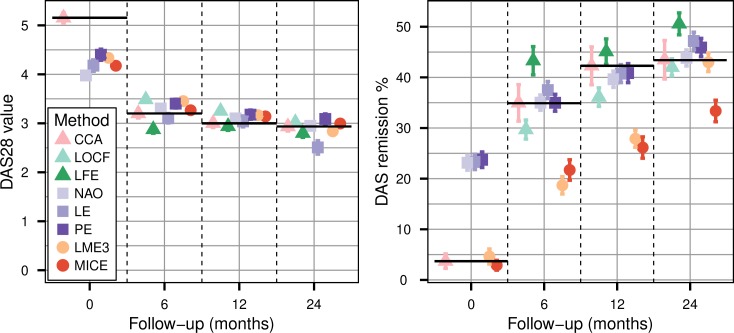
Figure 1.
Mean disease activity score based on 28 joints (left panel) and corresponding remission rate (right panel) of the data panel where the 60% of data missing completely at random at follow-up were handled with complete case analysis (CCA), last observation carried forward (LOCF), linear forward extrapolation (LFE), nearest available observation (NAO), linear extrapolation (LE), polynomial extrapolation (PE), linear mixed effect cubic regression (LME3) and multiple imputation by chained equation (MICE). Error bars are the standard errors calculated over the 1000 simulation samples. LFE and LOCF estimation are missing for t=0 since these methods use previous values, which do not exist at baseline. Black horizontal lines represent the true values for each follow-up.

