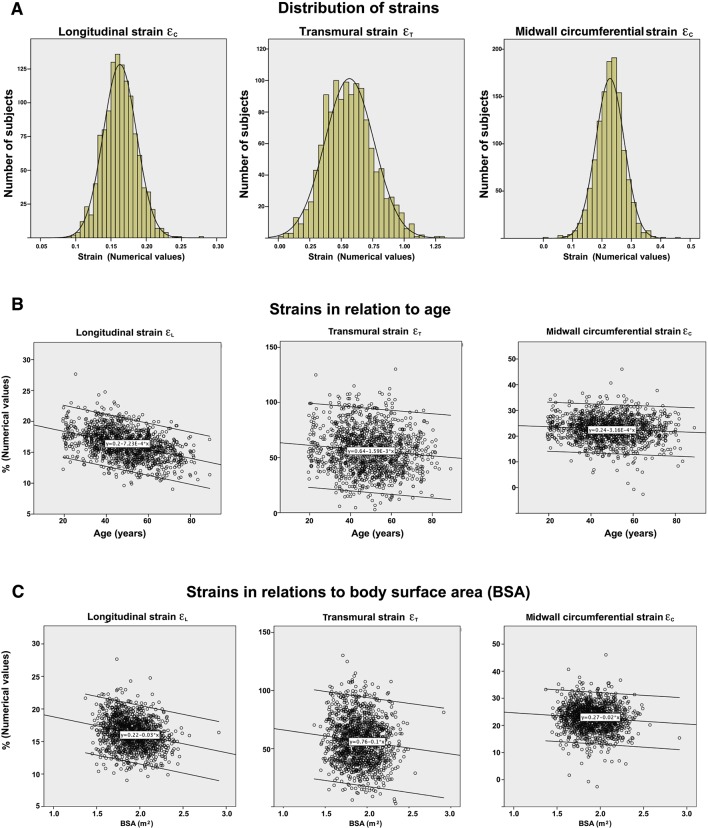
Figure 3.
The distribution and relation with age and body surface area (BSA) of the three normal strains. Diagrams show numerical values. (A) Normal distribution of all the three strains (normal distribution curve is added for comparison) in the population. (B) Relations to age. Numerical values of all strains decrease with age. The effect was most profound for longitudinal strain. (C) Relations to BSA. Numerical values of all strains are inversely related to BSA, despite strain being relative to heart size. Again, the relation was strongest for longitudinal strain.

