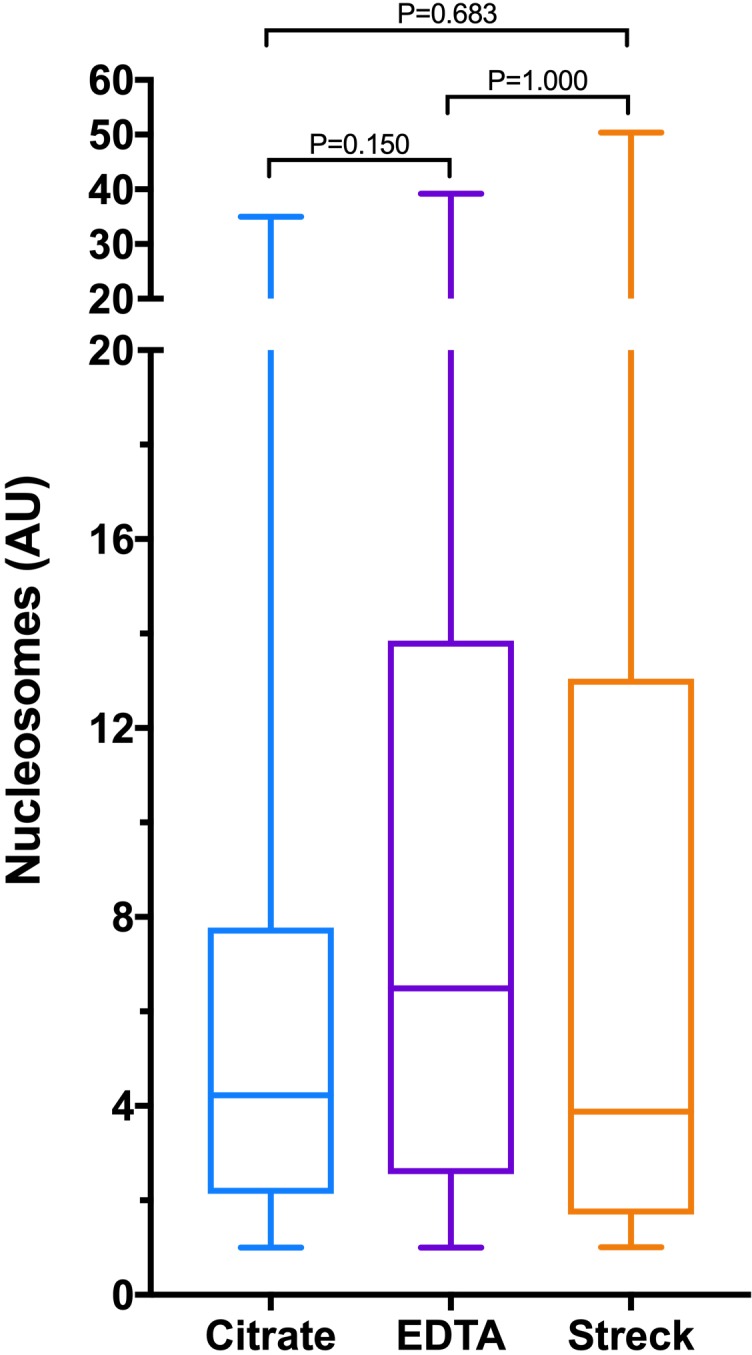
Figure 3.

Box and whisker plots comparing nucleosome concentrations in a heterogeneous group of dogs measured in three different sample types (citrate plasma, ethylenediamine tetraacetic acid plasma, plasma derived from Streck BCT tubes that include a preservative to limit cell lysis). The centre line represents the median, the boxes represent the IQR and the whiskers represent the minimum and maximum values. There were no significant differences between the concentrations of nucleosomes in any of the sample types.
