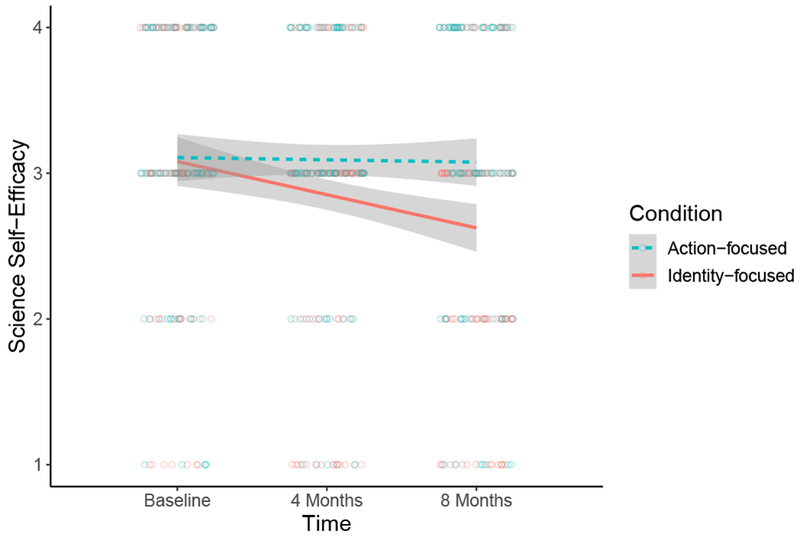
Figure 2.

The lines show the predicted values for the interaction between time and condition for how good children think they will be at “being scientists” or “doing science” over time, with shaded regions representing +/− 1 SE . Small circles reflect the responses of individual children at each point in time and are jittered to make the distribution of responses easier to see.
