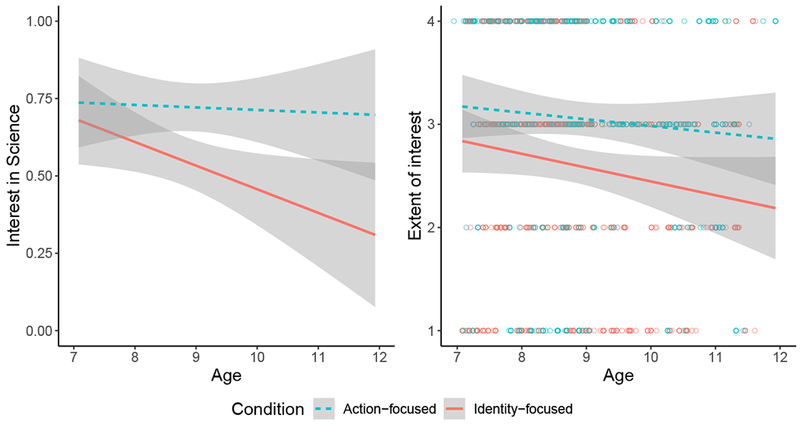
Figure 3A (left) and 3B (right).

The left panel shows the predicted probabilities for children’s responses for main effects of condition and time regarding whether they want to “be a scientist” or “do science”. The right panel shows the predicted values for main effects of condition and time for how much children want to “be scientists” or “do science”. In both graphs, shaded regions represent +/− 1 SE. Small circles reflect the responses of individual children at each point in time and are jittered to make the distribution of responses easier to see.
