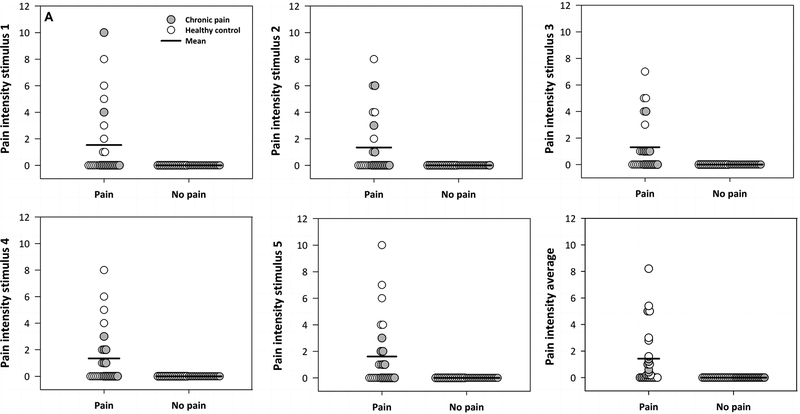
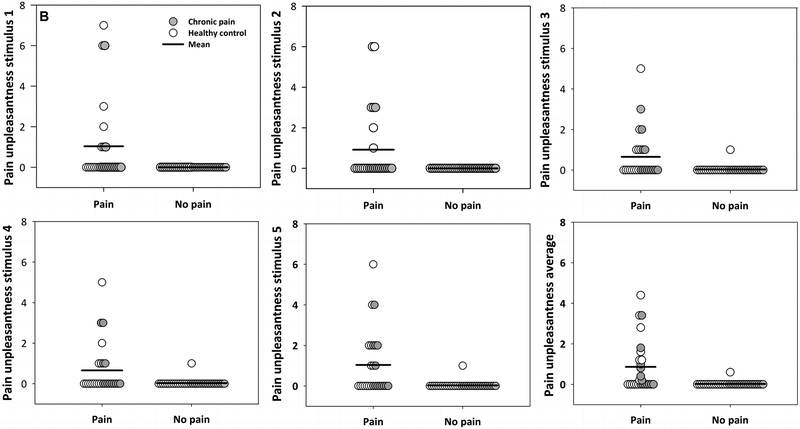
Figure 3. Between-condition comparison of pain ratings across five sequential non painful stimuli (40°C).
Panel A depicts pain intensity ratings and Panel B depicts pain unpleasantness ratings for participants in the ‘pain’ and ‘no pain’ conditions across five repeated exposures to non painful thermal stimuli. These figures illustrate that there was a greater amount of variability in the ‘pain’ condition compared to the ‘no pain’ condition in terms of perceptual responses to the non painful thermal stimuli.


