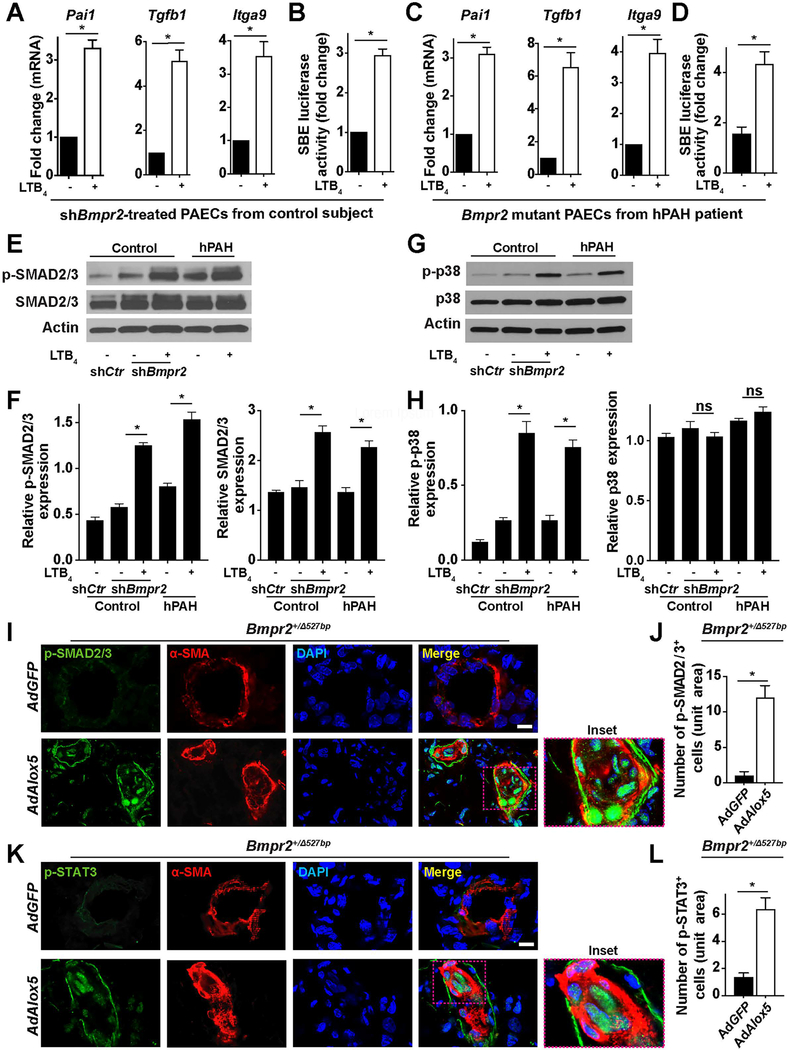
Figure 5. Attenuated BMPR2 signaling promotes TGF-β activation in PAECs following exposure of LTB4.
(A) RNA transcription of Pail, Tgfβ1 and Itaga9 in human control PAECs assessed by qPCR on day 7. n=6. (B) SBE (SMAD binding element)-mediated reporter assays. n=6. (C) RNA transcription of Pail, Tgfβ1 and Itaga9 in hPAH-PAECs assessed by qPCR on day 7. n=6. (D) SBE-mediated reporter assays. n=6. (E and F) Representative western blots and densitometry quantification of phosphorylated-(p-) SMAD2/3 and SMAD2/3. n=3. (G and H) Representative western blots and densitometry quantification of p-p38 and p38. n=3. (I–L) Representative immunofluorescent images and quantification of lung sections stained with p-SMAD2/3 (green, I) or p-STAT3 (green, K). α-SMA (red) identifies pulmonary vessels. Insets identify the transformed neointima. DAPI (blue) counter-stains nuclei. n=6 for each group; scale bar, 50μm. All data are presented as mean and SEM; for panels A–D, J and L, Mann-Whitney test; for panels F and H, Kruskal-Wallis test; ns, not significant, *p< 0.05.

