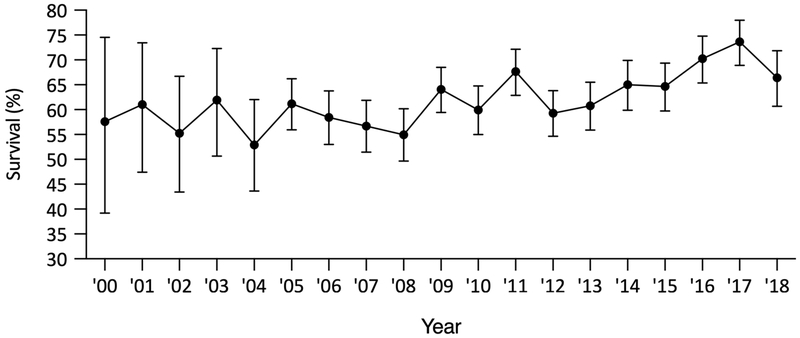
Figure 3. Survival trends for non-pulseless events.
The figure illustrates unadjusted trends in survival to hospital discharge from 2000 to 2018. Results are reported as absolute risks with 95% confidence intervals. The absolute change in survival to hospital discharge was 0.80% (95%CI, 0.32%–1.27%; p = 0.001; Table S7) per unit increase in year. Non-pulseless events refer to events requiring cardiopulmonary resuscitation for bradycardia and poor perfusion.

