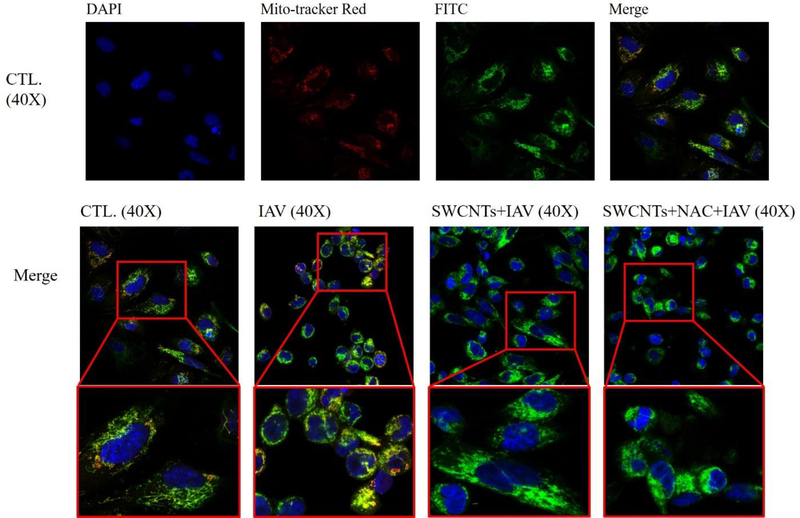
Figure 8.
Changes in MAVS colocalization in SAEC by SWCNTs, NAC, and IAV. SAEC were exposed to 50 μg/mL SWCNTs for 24 hours, then NAC (1mM) for 2 hours, followed by IAV infection at MOI=0.5 for another 24 hours. Cells were fixed for immunofluorescence staining to visualize co-localization of mitochondria (mitotracker red), MAVS protein (Anti-MAVS FITC, green), and nucleus (DAPI, blue) as indicated by square in the figures.

