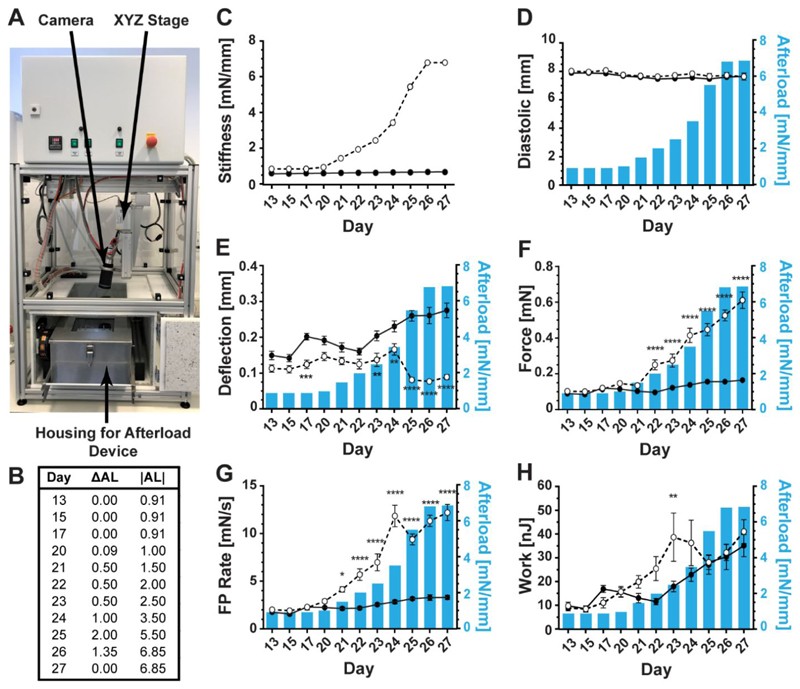
Figure 4. Tissue measurements.
measured properties of control (solid line and closed circles) and afterload-affected (dashed line and open circles) tissues when increasing tissue load from a stiffness of 0.91 mN/mm to 6.85 mN/mm, over a one-week period. (A) Picture of afterload device in the assessment environment. (B) Tissue afterload regimen, where ΔAL indicates the change in environmental afterload from the previous day and |AL| is the magnitude of afterload on each day. (C) Environmental afterload experienced by control (solid line and closed circles) and afterload-affected (dashed line and open circles) tissues over the testing period. (D) The average diastolic length of the tissues remained relatively unchanged during the testing period for afterload-affected and control tissues. (E) Post deflection increased over time in both control and afterload-affected rEHTs, however, a sharp decline occurred in afterload-affected tissues on day 25, which was partially recovered by day 27. (F) The average contractile forces produced by the tissues during the testing period increased for both experimental groups, but to a much higher degree in afterload-affected tissues. (G) The rates of tissue contraction also continually increased for both groups of tissues, with the exception of a small decrease in afterload-affected tissues on day 24. (H) Tissue work production followed an increasing trend in control rEHTs. Contractile work in afterload-affected rEHTs also initially increased, but began to decline on day 24 and continued declining until day 26. However, by day 27, these tissues had surpassed their day 23 values. Error bars in graphs represent standard error of the mean. Statistical significance was assessed for n = 12 control tissues and n = 12 afterload-affected tissues at p < 0.05, and p-values are graphically displayed as follows: * = p < 0.05, ** = p < 0.01, *** = p < 0.001, **** = p < 0.0001.

