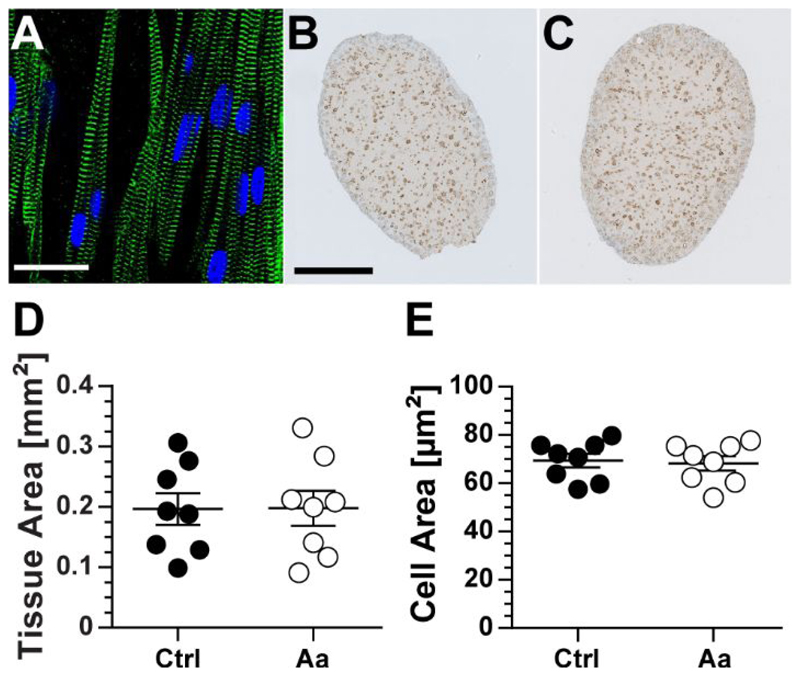
Figure 5. Tissue and cellular structure.
(A) Immunofluorescent image of a region close to the surface of a rat EHT stained with antibodies against α-actinin (green) and DRAQ5 (blue). Dystrophin stained cross-sections of (B) control (Ctrl) and (C) afterload-affected (Aa) tissues were analyzed for differences in (D) tissue and (E) cellular area. No significant differences in either parameter were found. Scale bar in immunofluorescent image is equivalent to 20 μm and that in dystrophin images equates to 200 μm. Error bars in graphs represent standard error of the mean. Statistical significance was assessed for n = 8 control tissues and n = 8 afterload-affected tissues at p < 0.05.

