FIG. 4.
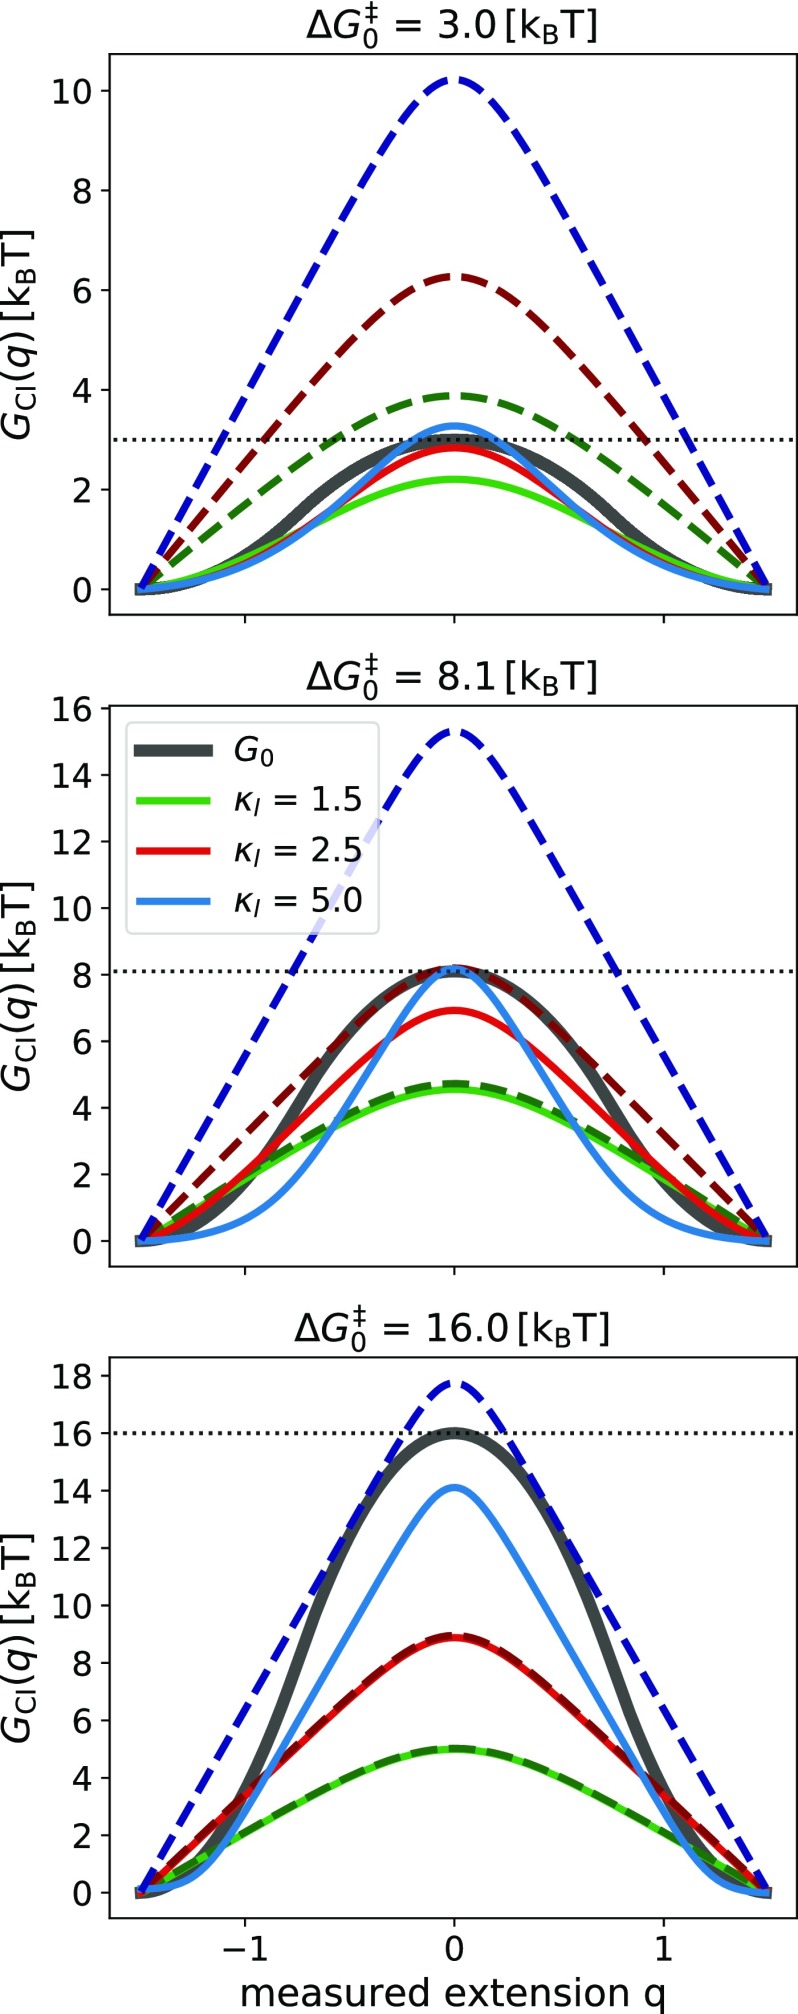
Free energy barrier extracted by committor inversion, GCI(q), using the observed committor (solid lines) and the analytic approximation of Eq. (11) (dashed lines and darker shade of color). We varied the height of the hidden molecular barrier (, 8.1, and 16 kBT, from top to bottom) and the linker stiffness (κl = 1.5, 2.5, and 5 kBT/[q]2, green, red, and blue lines, respectively). We used the matched-harmonic free energy function from Eq. (12) with Δx‡ = 1.5 [x]. For reference, each panel shows the respective hidden molecular profile Go (gray solid line).

