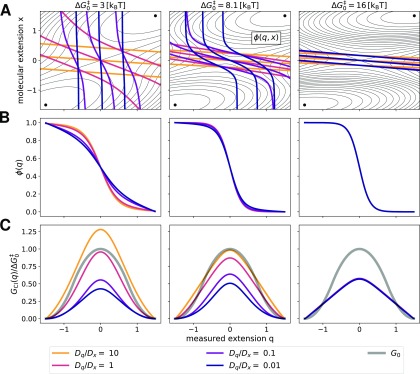
FIG. 7.
Effect of diffusion anisotropy on committors and free energy barriers extracted by committor inversion. (a) Free energy surfaces and corresponding full committor calculated for different diffusion anisotropies Dq/Dx and increasing values of the molecular barrier height ( 3, 8.1, and 16 kBT, from left to right) with κl = 2.6 kBT/[q]2 in each case. Isolines of the free energy surfaces are shown as black solid lines separated by 1 kBT. Isolines of the committor corresponding to 0.2, 0.5, and 0.8 (from top-right to bottom-left) are shown as colored solid lines. (b) Corresponding observed committor as a function of diffusion anisotropy Dq/Dx. (c) Barrier GCI(q) obtained by inversion of the observed committors shown in (b). The hidden molecular barrier G0 is reported as a gray solid line. In each panel of (c), free energies are measured in units of the corresponding value of . Color code for diffusion anisotropy Dq/Dx: 10 orange, 1 red, 0.1 purple, and 0.01 blue. In the rightmost panel, the curves for GCI(q) are superimposed.

