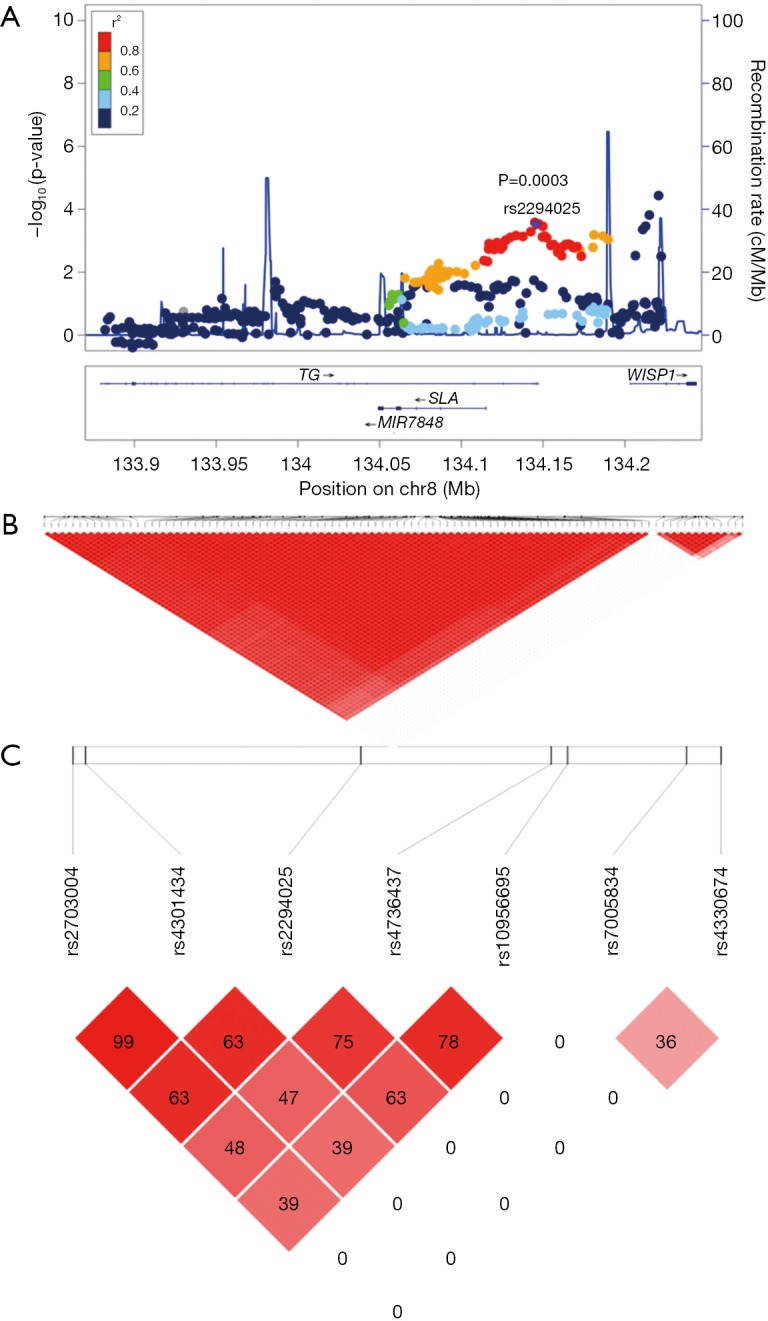
Figure 1.

Results of association analysis for SNPs in 8q24.22 in the discovery stage. (A) In the discovery stage the regional plots of susceptibility loci associated with Graves’ disease (GD) in 8q24.22. The -log10 P values of each SNP at 8q24.22 are plotted against chromosomal position. The top SNP at 8q24.22 is rs2294025 shown as a big purple diamond. The color of each SNP spot reflects its r2 value with rs2294025 and decreasing values of r2 demonstrates with various colors from red, orange, green to sky-blue and blue. One thousand genomes from Asian samples were used to compute genetic recombination rates. Physical positions are based on GRCh37; (B) Haploview analysis results of 85 SNPs of Block 1 and 13 SNPs of Block 2, two highly linked independent susceptible blocks. The number in each small square represents the interlocking unbalance r2 value seen in two SNPS. The big red represents the complete interlocking r2=1. The higher the interlocking degree is, the closer the color is to the big red and the completely non-interlocking color is white; (C) in the replication stage, Haploview analysis of the 7 TagSNPs. The number in each small square case represents the Linkage disequilibrium r2 value between the two SNPs, and red represents the complete Linkage disequilibrium r2=1. The higher the Linkage disequilibrium is, the closer the color is to black, while the completely non-Linkage disequilibrium value is white.
